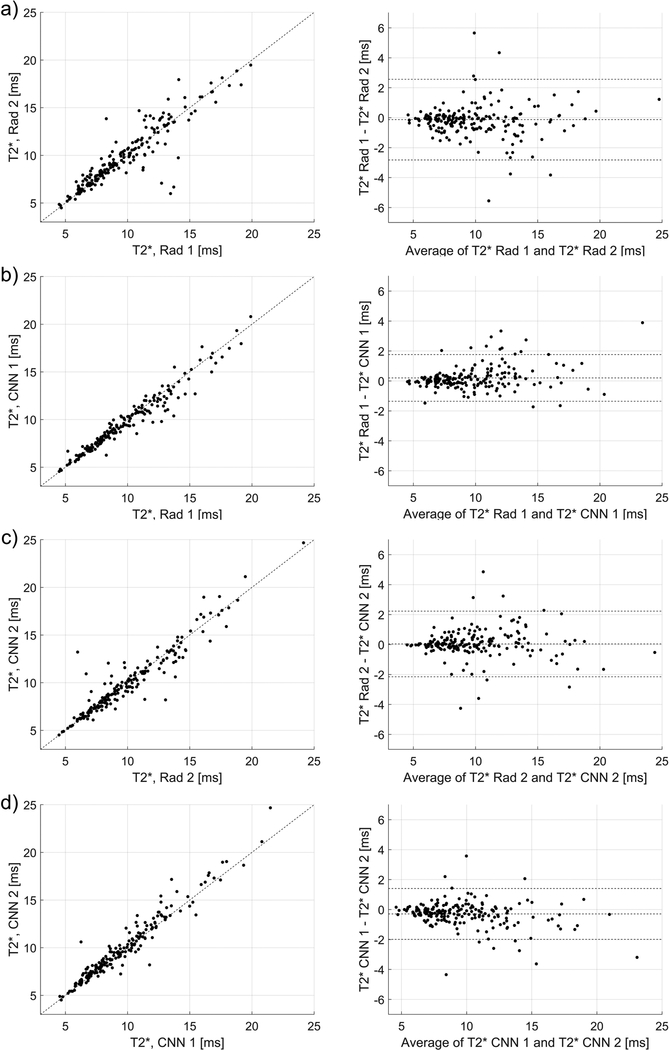
Figure 5.
The relationships and Bland-Altman plots for the average T2* values calculated using the manual and automatic segmentations provided by the radiologists and the CNNs, a) relationship for the radiologists’ ROIs (linear correlation coefficient of 0.92, p-value<0.001), b) relationship between the CNN1 and CNN2 (0.95, p-value<0.001). c) and d) show the corresponding relationships for the CNN 1 (0.97, p-value<0.001) and CNN 2 (0.95, p-value<0.001) in respect to the radiologists’ ROIs, which were used to develop the model.

