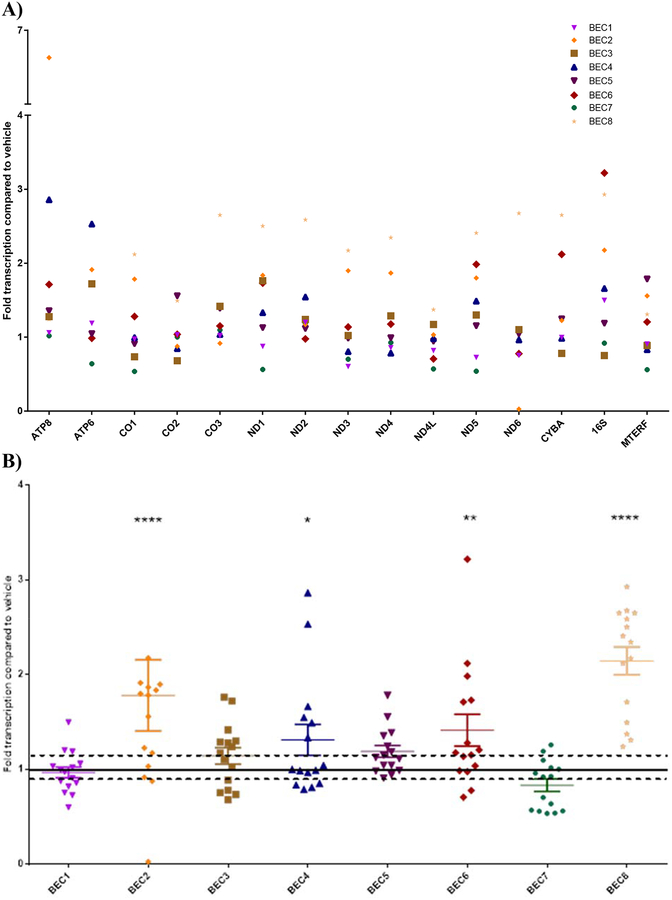
Figure 3.
Mitochondrial gene expression in BECs exposed to 3 μg/ml MWCNTs, as measured by QPCR. Values are expressed as fold control (dispersion vehicle-treated) BECs, with each symbol representing the mean of 3 experimental replicates of a different donor (A). Inter-individual variation was found across the mitochondrial genes in response to MWCNT exposure, while MTERF (a nuclear-encoded mitochondrial regulatory gene) transcription was not significantly altered by treatment. Some donors were “responders” (such as BECs 2, 4, 6, and 8, identified by p < 0.05 on 2-way ANOVA) that consistently upregulated all or most mitochondrial genes in response to MWCNTs, while others were not significantly changed from controls. This donor variation is illustrated in Figure 3B, showing donor-specific patterns of up/downregulation when all genes from a given donor are combined. Dotted lines in Figure 3B indicate the standard deviation around the mean value for vehicle-treated controls (*p < 0.05, **p < 0.02, ****p < 0.0001).

