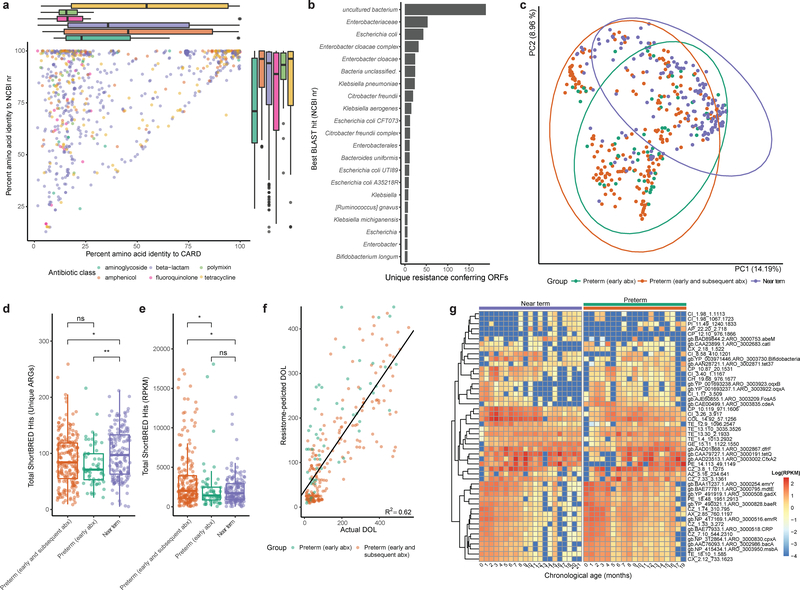
Figure 3 |. Preterm infants harbor an enriched gut resistome.
a, Amino acid identity between all functionally-selected ARGs and their top hit in CARD vs their top hit in the NCBI nr protein database, colored by class of antibiotic used for selection. Notably, ARGs recovered by fluoroquinolone and polymyxin selection have very low median identity to CARD. Box plots represent the first quartile, median, and third quartile of the data with whiskers extending to the last data point within 1.5× the interquartile range, n=879 ARGs. b, The most commonly predicted hosts of functionally-selected ARGs based on highest identity BLAST hit in the NCBI nr protein database. c, Gut resistome composition is distinct between near-term infants, preterm infants with early only antibiotic treatment, and preterm infants with early and subsequent antibiotic treatment (Bray-Curtis, p<0.001, Adonis, n=437 samples). d, Preterm infants had fewer unique ARGs encoded in their gut metagenomes than near-term infants. (* p<0.05, ** p<0.01 two-sided Wilcoxon, n=437 samples). Box plots represent the first quartile, median, and third quartile of the data with whiskers extending to the last data point within 1.5× the interquartile range. e, The cumulative resistome relative abundance was significantly higher in the gut microbiota of preterm infants with early and subsequent antibiotic treatment compared to both preterm infants with only early antibiotic treatment and near-term infants (* p<0.05, two-sided Wilcoxon, n=437 samples). Box plots represent the first quartile, median, and third quartile of the data with whiskers extending to the last data point within 1.5× the interquartile range. f, A random forests model trained on preterm infant gut resistome poorly predicts chronological age of near-term infants. Black line is linear regression line of day of life as predicted by the random forests model against the actual day of life (R2=0.62, n=437 samples) g, Relative abundance of 50 most informative resistance genes over the first months of life in near-term (left heatmap) and preterm (right heatmap) infants. Resistance genes are hierarchically clustered and listed to the right of the heatmaps. Colored bars above heatmaps correspond to colors in panels c-e. For canonical resistance genes, the CARD accession is displayed and for resistance genes functionally-selected in this study, the relevant selection information is listed.

