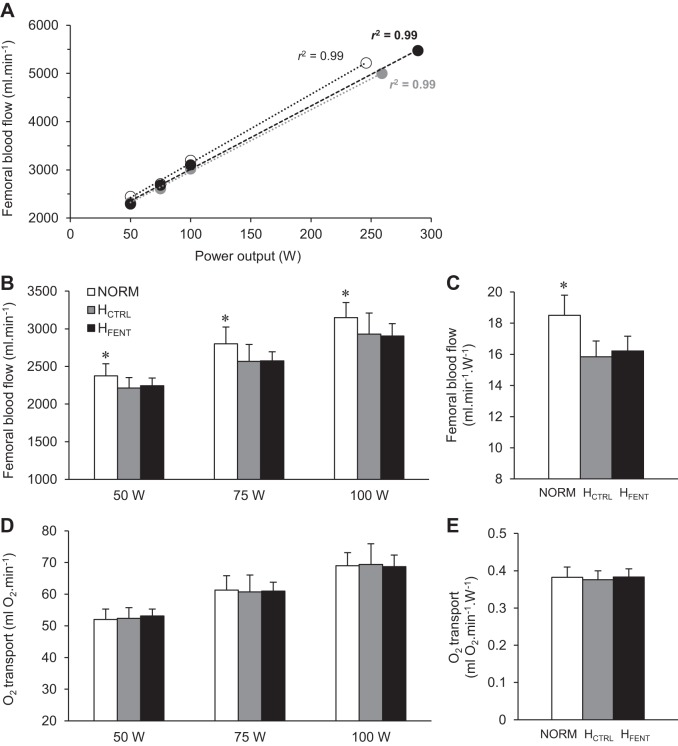
Fig. 2.
Femoral artery blood flow (FBF) and leg O2 delivery during cycling exercise. A: the linear relationship between FBF and exercise intensity of a representative subject with the associated linear regression coefficients calculated for each condition and on an individual basis (r2 range across all subjects: 0.95–0.99). B and D: blood flow response and O2 delivery during 3 different workloads. NORM, normoxia; HCTRL, control hyperoxia; HFENT, fentanyl hyperoxia. C and E: as the average wattage during the 3 time trials was different between conditions, FBF and O2 delivery were normalized for the mean power output achieved in each trial (NORM 261 W, HCTRL 288 W, HFENT 310 W). *P < 0.05 vs. HCTRL and HFENT.

