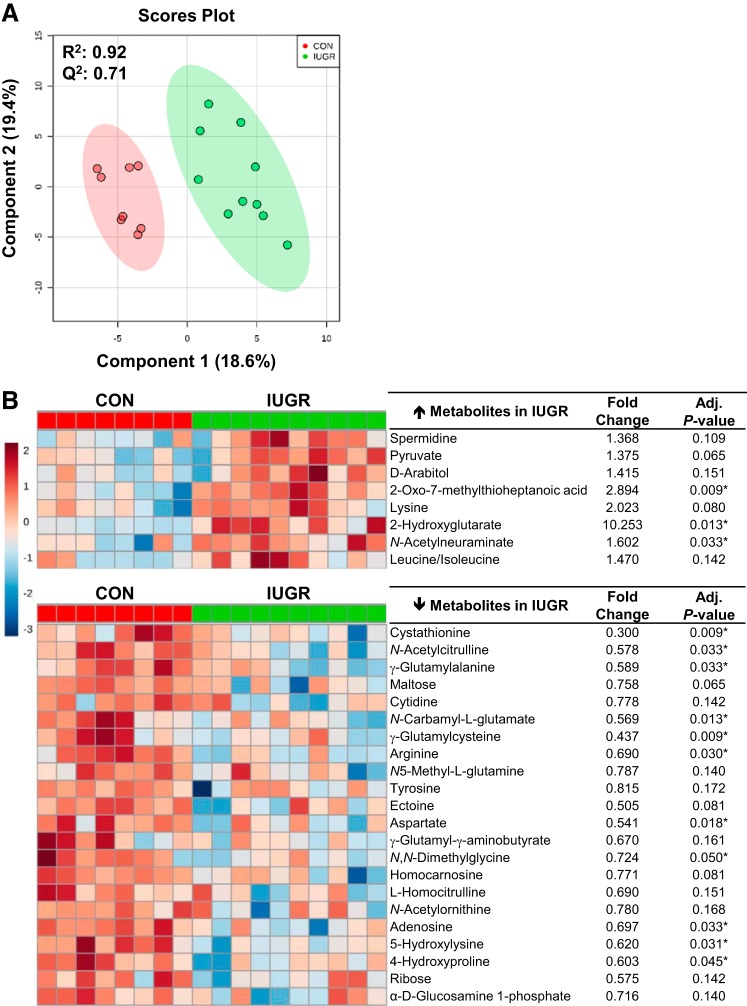
Fig. 1.
Metabolomic profiles of skeletal muscle of intrauterine growth restriction (IUGR) and control (CON) fetuses. A: partial least squares discriminant analysis was used to identify metabolites with changes in abundance that defined separation of samples between the IUGR (n = 10 fetuses) and CON (n = 8 fetuses) groups. B: heat map of the 30 metabolites with the highest variable importance in projection scores. Each square is representative of the mean levels of that metabolite for the individual animal. Row values are normalized for each metabolite, and quantitative changes are color coded from red (high) to blue (low). Student’s t test was conducted to detect differences in fold change. *False discovery rate-adjusted P ≤ 0.05.

