Fig. 1.
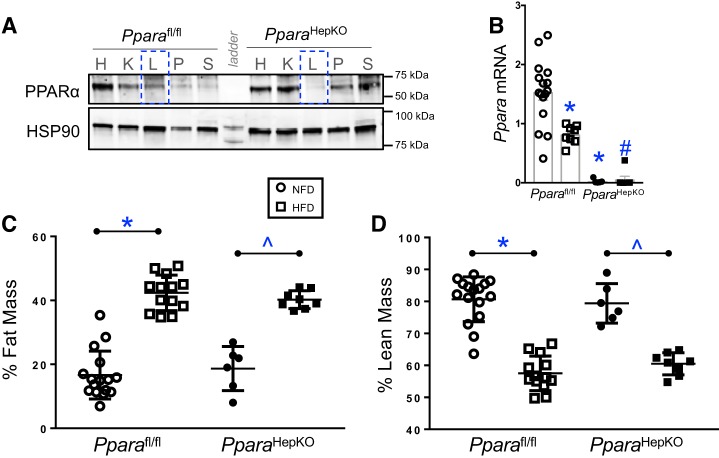
Percent body fat and lean mass in peroxisome proliferator-activated receptor-α (PPARα) wild-type (Pparafl/fl) and PPARα hepatocyte-specific knockout (PparaHepKO) mice fed a high-fat (HFD) or normal fat diet (NFD). A: Western blot analysis for PPARα and heat shock protein 90 (HSP90) as loading control in various tissues from Pparafl/fl and PparaHepKO mice. H, heart, K, kidney, L, liver, P, pancreas, S, spleen. Dotted blue line, specific loss of PPARα in the liver. B: Ppara mRNA levels in NFD and HFD in Pparafl/fl and PparaHepKO mice. C: fat mass was directly measured at the end of the experimental protocol by noninvasive EchoMRI. D: lean mass was determined by noninvasive EchoMRI. Values are means ± SE; *P < 0.05 vs. NFD; #P < 0.05 vs. HFD Pparafl/fl; ^P < 0.05 vs. NFD PparaHepKO; n = 16 and13, Pparafl/fl NFD, HFD; n = 6 and 8, PparaHepKO NFD, HFD. n, number of mice. All circles, NFD; all squares, HFD.

