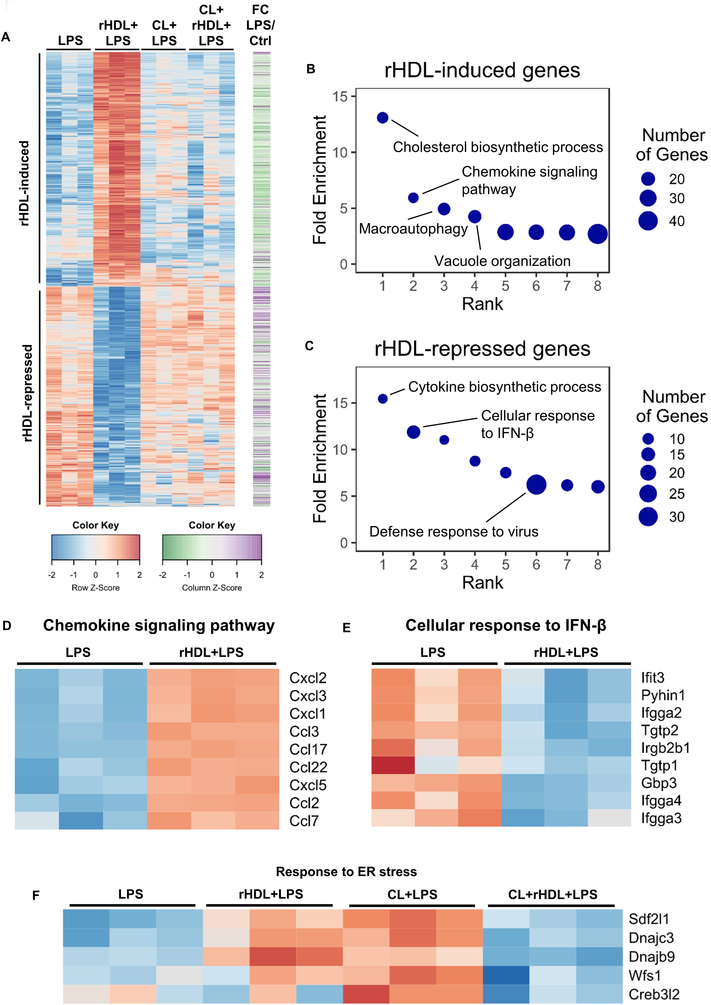
Figure 1. Transcriptome profiling of rHDL-treated macrophages in response to LPS.
Wild type BMDMs were treated for 20 hours with 150 μg/ml rHDL (reconstituted HDL), washed with PBS and stimulated with 100 ng/mL LPS for 4 hours and harvested for RNA-Seq (n=3/condition). For cholesterol loading (CL) macrophages were incubated with POPC/cholesterol-liposomes (~ 1 mg cholesterol/ml) for 20 hours prior to rHDL treatment. (A) Heatmap of >1.5-fold induced or repressed genes at 5% FDR colored by row-normalized Z score, with extent of induction by LPS indicated on right (FC; Fold change). (B, C) PANTHER GO categories enriched in rHDL-induced or rHDL-repressed genes (Bonferroni-adjusted P < 0.05). Row-normalized z-score for (D) rHDL-induced genes in the GO category “Chemokine signaling pathway”, (E) rHDL-repressed genes in the GO category “Cellular response to interferon β” and (F) ER stress response genes affected by rHDL in both the cholesterol loaded and non-cholesterol loaded conditions. See also Supplemental Figure I.

