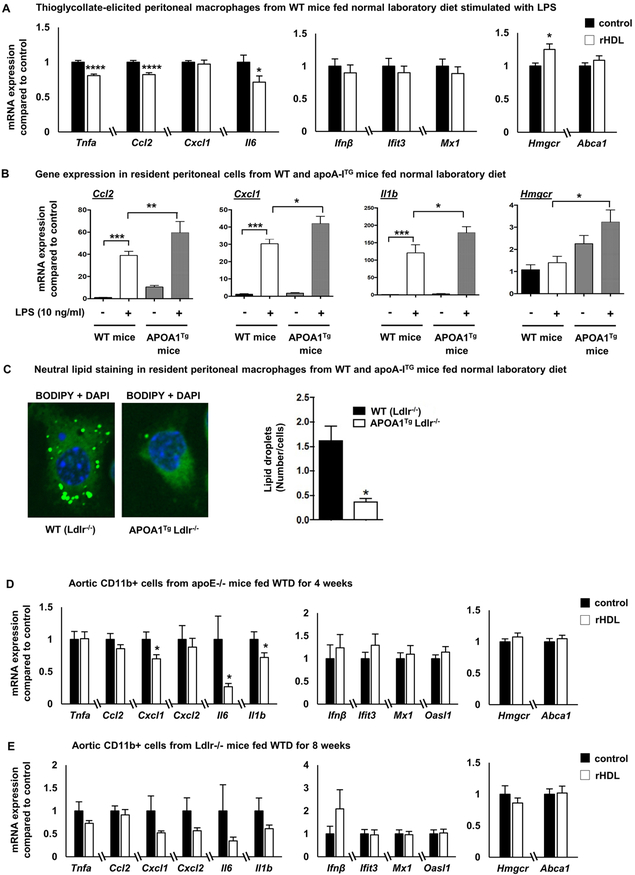
Figure 6. In vivo effects of HDL on macrophage inflammatory gene expression.
(A) Wild type C57BL/6 mice fed a normal laboratory diet were injected intravenously with 80 mg/Kg rHDL (n=8) or PBS daily (n=7), for a total of 5 days before sacrificing the mice 2 hours after the last rHDL injection. Thioglycollate was injected intraperitoneally 3 days before sacrificing the mice and peritoneal macrophages were collected, stimulated with LPS (100 ng/ml, 2 h) and inflammatory gene expression was assessed. (B) Effect of LPS (10 ng/ml, 4 hours) on inflammatory genes in resident peritoneal macrophages isolated from normal laboratory diet-fed APOA1Tg;Ldlr−/− mice or Ldlr−/− (WT) mice (n=7-8 per group). (C) Neutral lipid staining with BODIPY in resident macrophages isolated from APOA1Tg;Ldlr−/− mice (n=4) or Ldlr−/− littermates (n=4). (D) Apoe−/− mice fed a western type diet for 4 weeks were injected intravenously with 80 mg/Kg rHDL or PBS daily (n=29 per group), for a total of 5 days before sacrificing the mice 2 hours after the last rHDL injection. CD11b+ cells from whole aorta were collected and assessed for inflammatory gene expression, Hmgcr and Abca1 expression. (E) Ldlr−/− mice fed a western type diet for 8 weeks were injected intravenously with 80 mg/Kg rHDL or PBS daily (n=12 per group), for a total of 5 days before sacrificing the mice 2 hours after the last rHDL injection. CD11b+ cells from whole aorta were collected and assessed for inflammatory gene expression, Hmgcr and Abca1 expression. The results are shown as mean ± SEM. Significance was determined by multiple t-tests using the two-stage linear step-up procedure of Benjamini, Krieger and Yekutieli, with Q = 5%, *p<0.05, ****p<0.0001 (A), one-way ANOVA with Tukey’s multiple comparisons test (B) or by unpaired t test with Welch’s correction for data not having equal variances or Mann-Whitney U test for data not passing normality *p<0.05 (D, E). See also Supplemental Figure VI.

