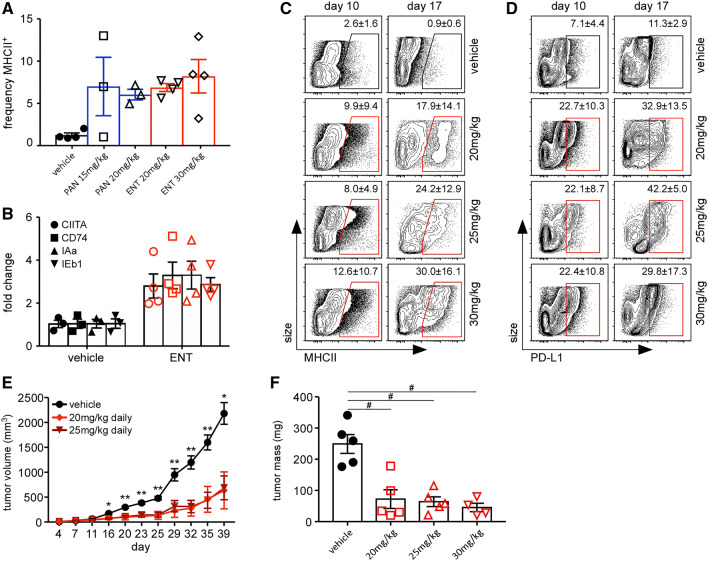
Fig. 2.
ENT induces expression of MHCII and PD-L1 and impairs tumor growth. a–f BALB/c mice were injected with TS/A cells and treated daily with the indicated inhibitors beginning on day 4. a Tumors were dissociated on day 14 and the frequency of MHCII+ cells CD45neg gate was determined by flow cytometry. Graph shows individual data as well as mean ± SEM of 3–4 samples/group. b RNA was extracted from whole tumors on day 14 and gene expression was determined by RT-PCR and normalized to vehicle. Graph shows individual data as well as mean ± SEM of 3–4 samples/group and is representative of three independent experiments. Flow plots show MHCII (c) and PD-L1 (d) expression on live, CD45neg cells from dissociated tumors on days 10 and 17. The mean ± SD is indicated in each plot with five mice/group/timepoint. e Tumor growth in mice treated with vehicle (19 mice), 20 mg/kg ENT (nine mice), or 25 mg/kg ENT (19 mice) daily for 2 weeks starting on day 4. f Tumor mass on day 17. Graphs show mean ± SEM. *p < 0.05, **p < 0.005, #p < 0.0005. Data are representative of three independent experiments

