Fig. 5.
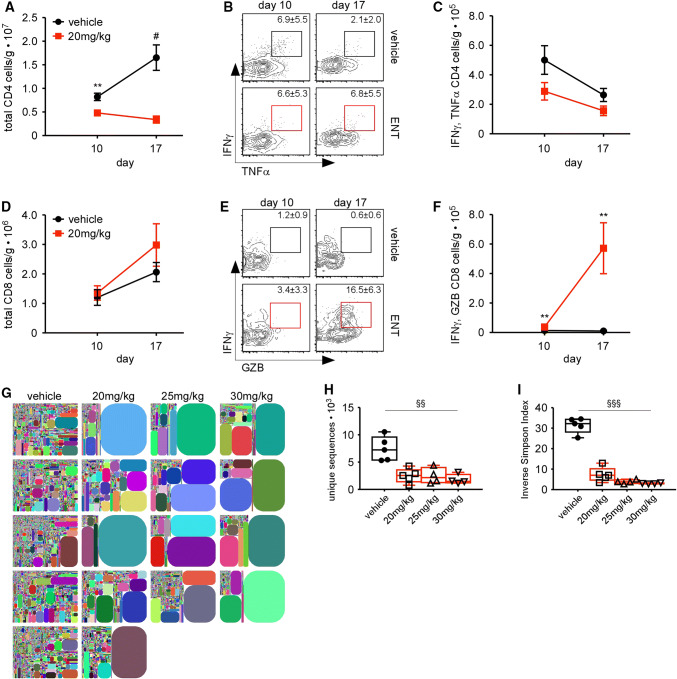
ENT promotes T-cell effector function and expansion. a–f Tumors from ENT-treated and control mice were dissociated on days 10 and 17 and infiltrating CD4+ T cells (a–c) and CD8+ T cells (d–f) were evaluated by flow cytometry. a Number of CD4+ T cells normalized to tumor mass. b Representative flow plots of CD4+ T cells expressing IFNγ and TNFα. c Number of CD4+ T cells producing IFNγ and TNFα normalized to tumor mass. d Number of tumor-infiltrating CD8+ T cells normalized to tumor mass. e Representative flow plots of CD8+ T cells expressing IFNγ and TNFα. f Number of CD8+ T cells producing IFNγ and granzyme B (GZB) normalized to tumor mass. Graphs in a, c, d, and f show mean ± SEM of 14 mice/group/timepoint; **p < 0.005, #p < 0.0005. Data are representative of two independent experiments. g–i TCRβ repertoire on day 14. g Tree plots showing relative TCRβ frequencies. h Unique sequences in each sample. i Inverse Simpson index quantifying the repertoire diversity of each sample. Box and whiskers plots show median and min and max values of 4–5 mice/group. Non-parametric statistical difference assessed using Kruskal–Wallis test (h, i) and expressed as §§p < 0.005, §§§p < 0.0005

