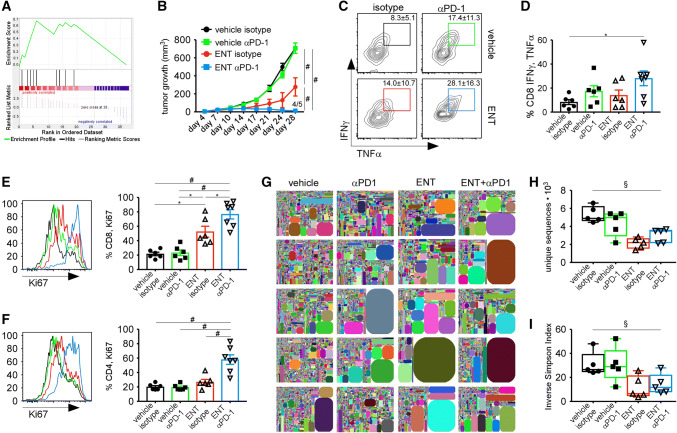
Fig. 6.
ENT sensitizes tumors to PD1 blockade. a Gene set enrichment analysis comparing genes differentially expressed genes in ENT-treated and control tumors and a list of IFNγ-inducible genes that predict response to PD1 blockade; normalized enrichment score of 1.45 and p value of 0.033. b Tumor growth in mice treated with combinations of ENT and anti-PD1. Graph shows mean ± SEM of 5 mice/group. c, d Representative flow plots (c) and graphs (d) showing the frequency of restimulated CD8+ T cells that express IFNγ and TNFα. Graph shows mean ± SEM of 6–7 mice/group. Data are representative of two independent experiments. e, f Ki67 expression by CD8+ TILs (e) and CD4+ TILs (f) following treatment with ENT and anti-PD1. Representative histograms are color-matched to the graphs, which show the mean ± SEM of 6–7 mice/group. Data are representative of two independent experiments. g–i TCRβ repertoire on day 14; five mice/group. g Tree plots of relative TCRβ frequencies. h Unique sequences in each sample. i Inverse Simpson index quantifying the repertoire diversity of each sample. Box and whiskers plots show median and min and max values. Statistical difference is expressed as *p < 0.05, **p < 0.005, #p < 0.0005 for parametric analyses, using one-way ANOVA with Tukey’s method for multiple comparison (b, d–f). Non-parametric statistical difference assessed using Kruskal–Wallis test (h, i) and expressed as §p < 0.05

