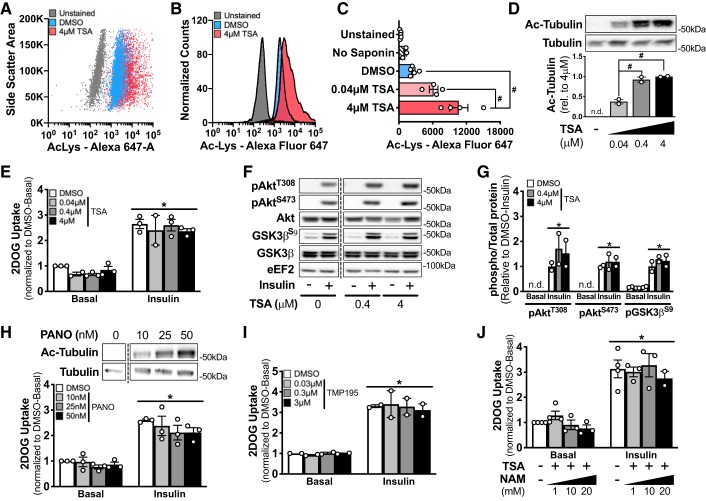
Fig. 1.
Acute inhibition of histone deacetylases (HDACs) increases acetylation but does not alter insulin-stimulated glucose uptake in L6 myotubes. A–C: representative experiment (A and B) and mean fluorescence intensity (C) for total acetylated proteins in unstained, stained without saponin, DMSO, and trichostatin A (TSA)-treated L6 myoblasts as analyzed by flow cytometry. Representative of data of 4 independent experiments. Ac-Lys, acetylated lysine. D: representative image and quantification for acetylated tubulin (Ac-tubulin) and total tubulin in L6 myotubes pretreated for 1 h with DMSO or TSA. E, H, I, and J: normalized basal and insulin (100 nM) 2-deoxy-d-glucose (2DOG) uptake in L6 myotubes pretreated for 1 h with DMSO or TSA (E), panobinostat (PANO; H), TMP195 (I), or TSA (4 μM; J) and nicotinamide (NAM). F and G: representative image (F) and quantification (G) of phosphorylated (p)AktT308 (pAktT308), pAktS473, total Akt, phosphorylated glycogen synthase kinase 3β (pGSK3βS9), and total GSK3β in basal and insulin-stimulated (− and +, respectively) L6 myotubes pretreated with or without TSA for 1 h. #P < 0.05, 1-way ANOVA with Tukey’s multiple comparison test. *P < 0.05, 2-way ANOVA, main effect of insulin. Trichostatin A treatment Western blots are representative of 2 independent experiments and 2DOG uptake assays are representative of 3 independent experiments. Data reported as means ± SE.

