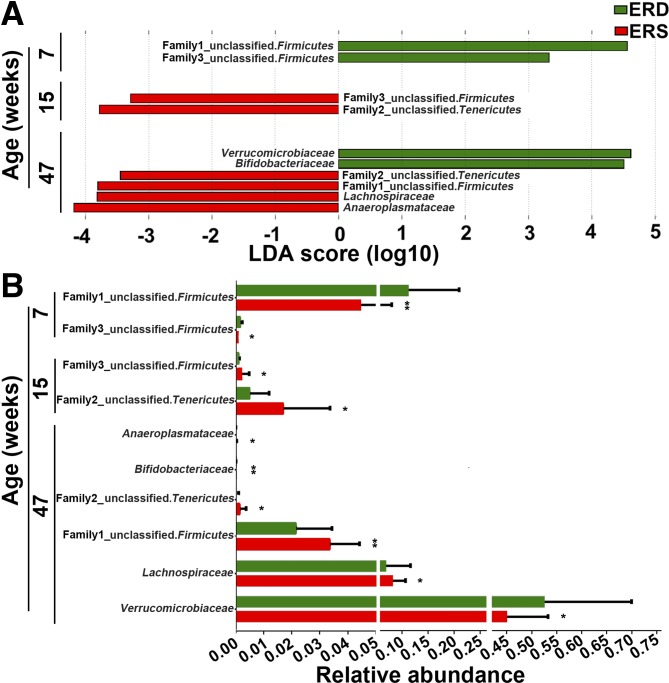
Fig. 2.
Bacterial families in ceca from mice fed exosome/RNA-sufficient (ERS) or exosome/RNA-depleted (ERD) diets beginning at age 3 wk. A: linear discriminant analysis (LDA) of effect size (LEfSe) analysis of families in ERS and ERD mice. Bars represent the LDA score. Diet effects are statistically significant for LDA scores greater than 2. B: relative abundance of the families in A. Values are expressed as means and SDs. MaAsLin, multivariate analysis by linear models; n = 16 per diet group and time point; *P < 0.05, **P < 0.01.

