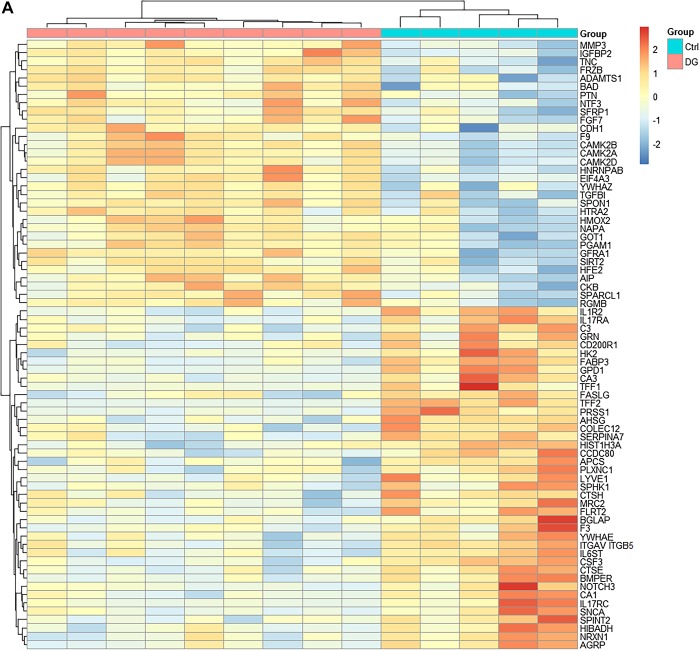
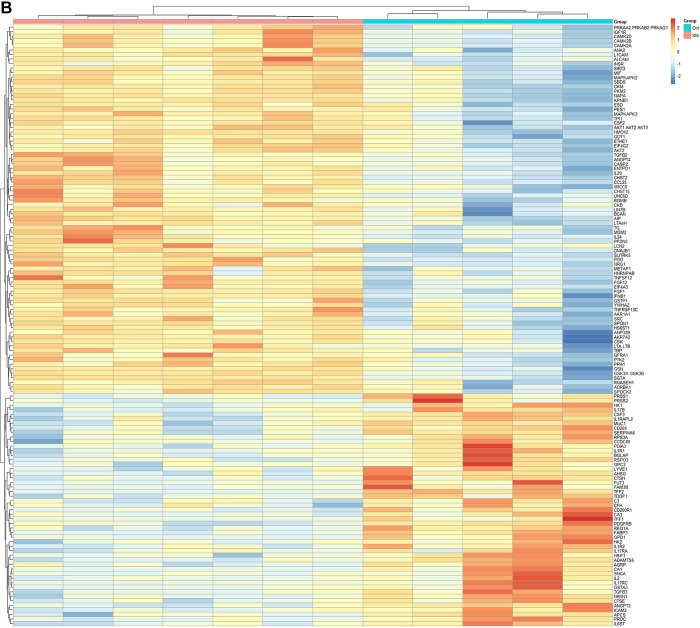
Fig. 1.
Heat map showing differentially expressed proteins (false discovery rate < 0.05). A: abundance of 73 proteins was changed in diabetic gastroparesis [n = 9 diabetic gastroparesis, 5 controls (Ctrl)]. B: abundance of 132 proteins was changed in idiopathic gastroparesis (n = 7 idiopathic gastroparesis, 5 controls). Ctrl, control; DG, diabetic gastroparesis.


