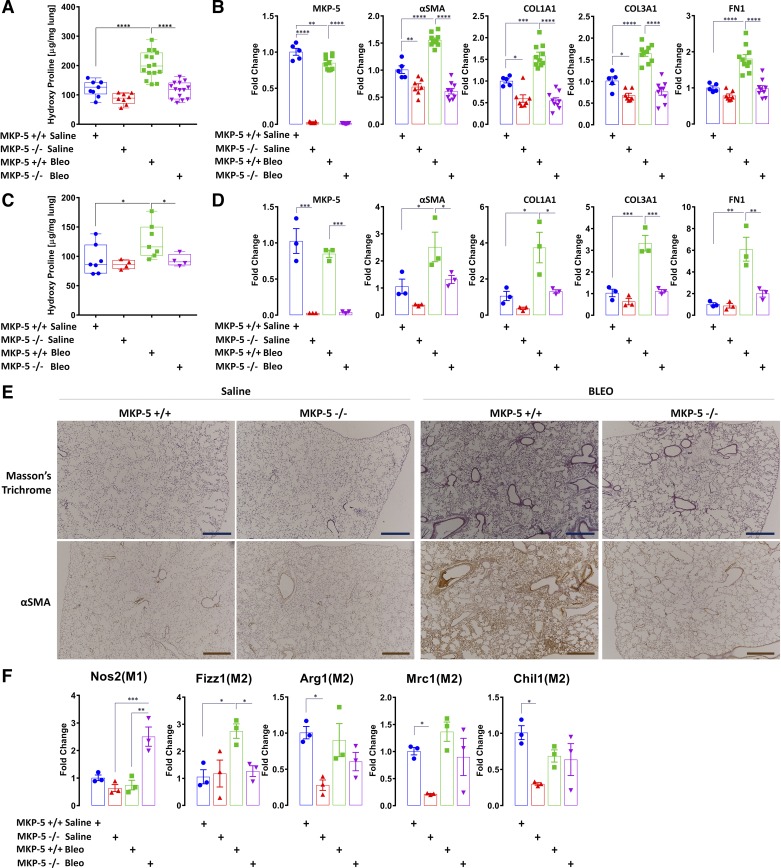
Fig. 1.
MAPK phosphatase 5 (MKP-5) knockout (MKP-5−/−) mice display attenuated fibrotic responses to bleomycin (Bleo) challenge. A: decreased collagen deposition, assessed by hydroxyproline content, following bleomycin challenge at day 14 in MKP-5−/− mice compared with wild-type littermates (MKP-5+/+; 116.14 ± 27.99 vs. 202.25 ± 45.98). Data (μg/mg right lung) are presented as box and whisker plots, with horizontal bars representing means ± SD, n = 8–15 mice from each group-treated animals. One-way ANOVA with Sidak correction for stepwise comparison, ****P < 0.0001. B: relative changes following bleomycin challenge at day 14 in dual-specificity protein tyrosine phosphatase 10 (DUSP10)/MKP-5, α-smooth muscle actin (α-SMA), collagen 1A1 (COL1A1), collagen 3A1 (COL3A1), and fibronectin (FN1) mRNA expression levels. Each bar represents mean ± SD expression of n = 5/10/7/9 mice from each group (biological replicates). Bars are shown for the relative changes (fold) by setting the indicated control level to 1.0. One-way ANOVA with Sidak correction for stepwise comparison, *P < 0.05, **P < 0.005, ***P < 0.0002, ****P < 0.0001. C: decreased collagen deposition, assessed by hydroxyproline content, following bleomycin challenge at day 21 in MKP-5−/− mice compared with MKP-5+/+ (93.23 ± 10.38 vs. 126.67 ± 29.73). Data (micrograms/milligrams right lung) are presented as box and whisker plots, with bars representing means ± SD, n = 7 for MKP-5+/+ and n = 4 for MKP-5−/− mice group-treated animals. One-way ANOVA with Sidak correction for stepwise comparison, *P < 0.03. D: relative changes following bleomycin challenge at day 21 in DUSP10/MKP-5, α-SMA, COL1A1, COL3A1, and FN1 mRNA expression levels. Each bar represents mean ± SD expression of n = 3 from each group sample (biological replicates). Bars are shown for the relative changes (fold) by setting the indicated control level to 1.0. One-way ANOVA with Sidak correction for stepwise comparison, *P < 0.05, **P < 0.005, ***P < 0.0008. E: Masson’s trichrome (top) and α-SMA (bottom) staining of representative lung sections (n = 4) from each group of treated mice. Decreased collagen deposition and α-SMA staining are observed in the interstitium, peribronchiolar or perivascular space, in MKP-5−/− mice compared with MKP-5+/+ mice. Scale bars, 100 μΜ. F: relative changes following bleomycin challenge at day 14 of M1/M2 macrophage markers. mRNA expression of nitric oxidase synthase-2 (Nos2) and resistin-like molecule-α (Fizz1), arginase 1 (Arg1), c-type mannose receptor 1 (Mrc1), and chitinase-like 3 protein 1 (Chil1), following challenge with bleomycin. Each bar represents mean ± SD expression of n = 3 from each group samples (biological replicates). Bars are shown for the relative changes (fold) by setting the indicated control level to 1.0. One-way ANOVA with Sidak correction for stepwise comparison, *P < 0.05, **P < 0.002, ***P < 0.001.

