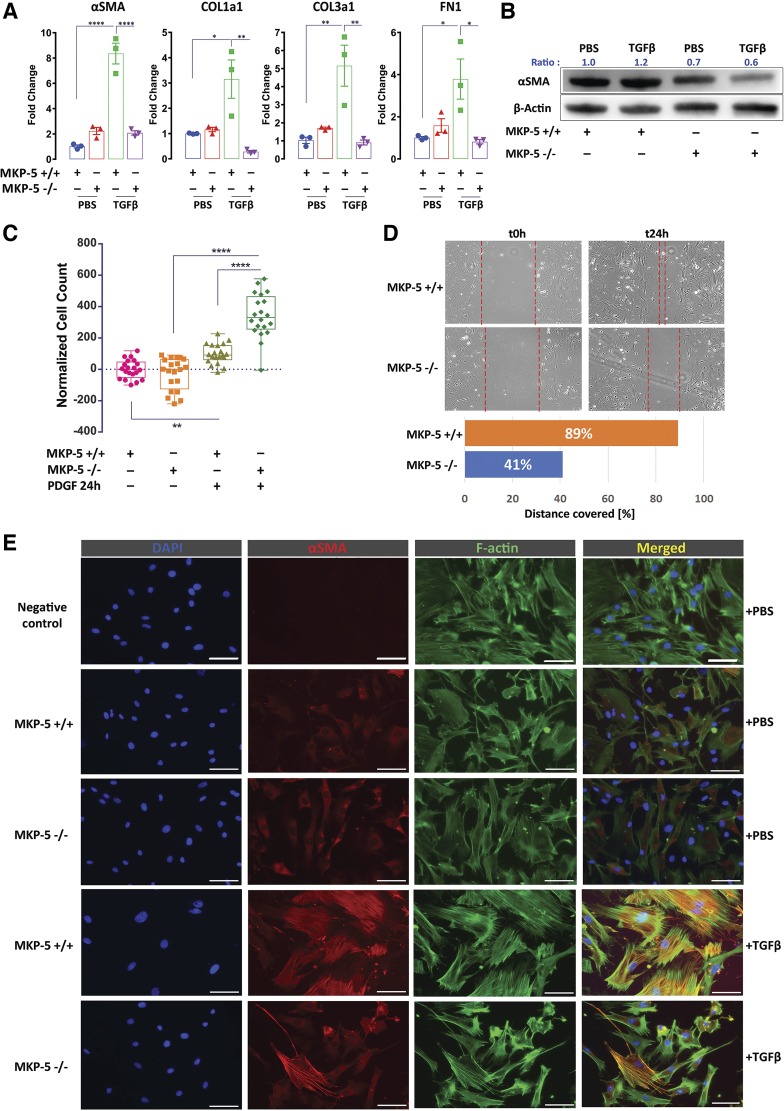
Fig. 2.
MAPK phosphatase 5 (MKP-5) inhibition attenuates fibroblast-to-myofibroblast differentiation and migration and increases proliferation of mouse lung fibroblasts. Primary mouse lung fibroblasts were isolated from C57BL/6, 9- to 12-week-old mice. MKP-5 knockout mice (MKP-5−/−) or wild-type mice (MKP-5+/+) were stimulated with transforming growth factor β1 (TGF-β1; 10 ng/mL) and then harvested for RNA and protein extraction. Normal human lung fibroblasts were transfected at 70% confluency with a specific dual-specificity protein tyrosine phosphatase 10/MKP-5 siRNA (10 nM) and a nontargeting siRNA (10 nM) as a control for 24 h. A: relative change in α-smooth muscle actin (α-SMA), collagen 1A1 (COL1A1), collagen 3A1 (COL3A1), and fibronectin (FN1) mRNA levels following stimulation with TGF-β1 or PBS. Each bar represents mean expression of 3 samples (in duplicates). Bars (means ± SD) are shown for the relative changes (fold) by setting the indicated control level to 1.0. One-way ANOVA with Sidak correction for stepwise comparison, *P < 0.02, **P < 0.004, ****P < 0.0001. B: immunoblot analyses of α-SMA and β-actin. Each lane represents an individual mouse lung fibroblast preparation (biological replicates). Blots were stripped and reblotted using an anti-β-actin antibody as loading control. Ratio indicates protein densitometry ratio of the target/control protein. C: MKP-5−/− mouse lung fibroblasts exhibited increased proliferation rates following stimulation with PDGF-BB (25 ng/mL) for 6 h compared with wild type (MKP-5+/+). Data analyzed at 24 h post-treatment (ratio of 24 h/0 hr absorbance) are presented as box–whisker plots with bars representing means ± SD, n = 20. One-way ANOVA with Sidak correction for stepwise comparison, **P < 0.085, ****P < 0.0001. D: scratch wound assay was used to quantify the migration capacity of MKP-5+/+ and MKP-5−/− fibroblasts at different time points: baseline (t0h) and at 24 h (t24h). The areas between the dotted lines define the migratory boundary. Bottom: bar plot depicts quantitation of percentage of actual distance covered. E: double immunofluorescence analysis showing colocalization (merged/yellow) of α-SMA (red) with F-actin (green) in MKP-5+/+ and MKP-5−/− mouse lung fibroblasts following stimulation with TGF-β1 or PBS. MKP-5−/− mouse lung fibroblasts exhibited reduced TGF-β1-induced differentiation to myofibroblasts, as indicated by reduced formation of stress fibers and α-SMA expression compared with MKP-5+/+. Scale bars, 50 μΜ.

