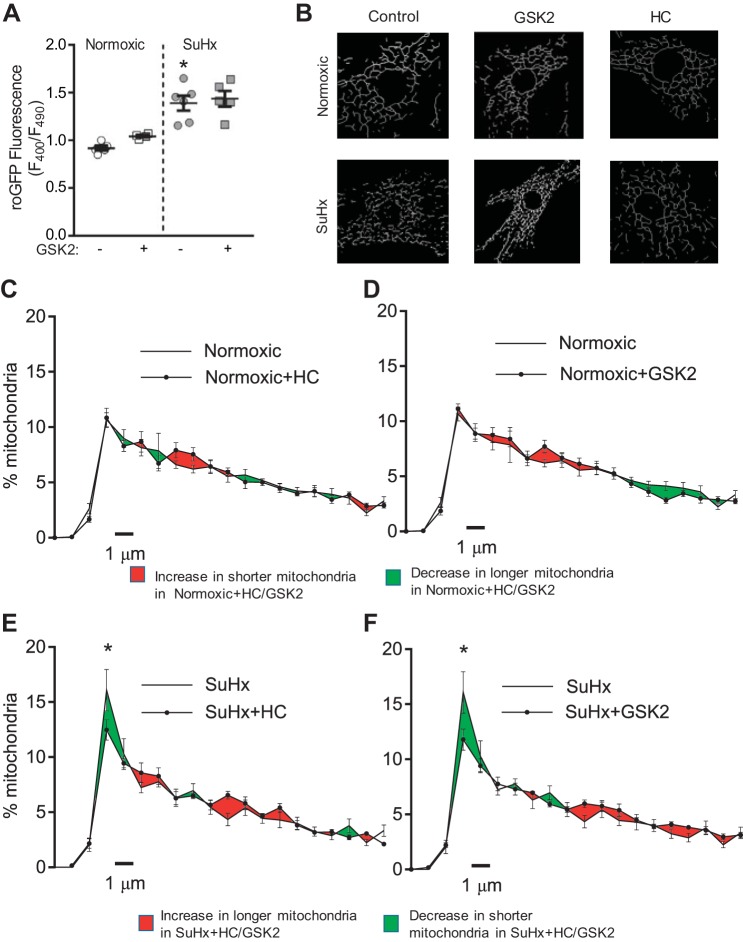
Fig. 5.
Transient receptor potential vanilloid-4 (TRPV4) and mitochondrial fragmentation in SuHx-MVECs. A: scatter plot showing means ± SE for roGFP ratios in N- and SuHx-MVECs with and without treatment with GSK2193874 (GSK2; 30 nM); n = 5–6 (from different animals)/group. Representative network images (B) and length distribution curves (C–F) for N- and SuHx-MVEC mitochondria with and without treatment with 2 TRPV4 inhibitors: HC-067047 (HC; 10 µM) and GSK2 (30 nM). *Significant difference from SuHx-MVECs (ANOVA).

