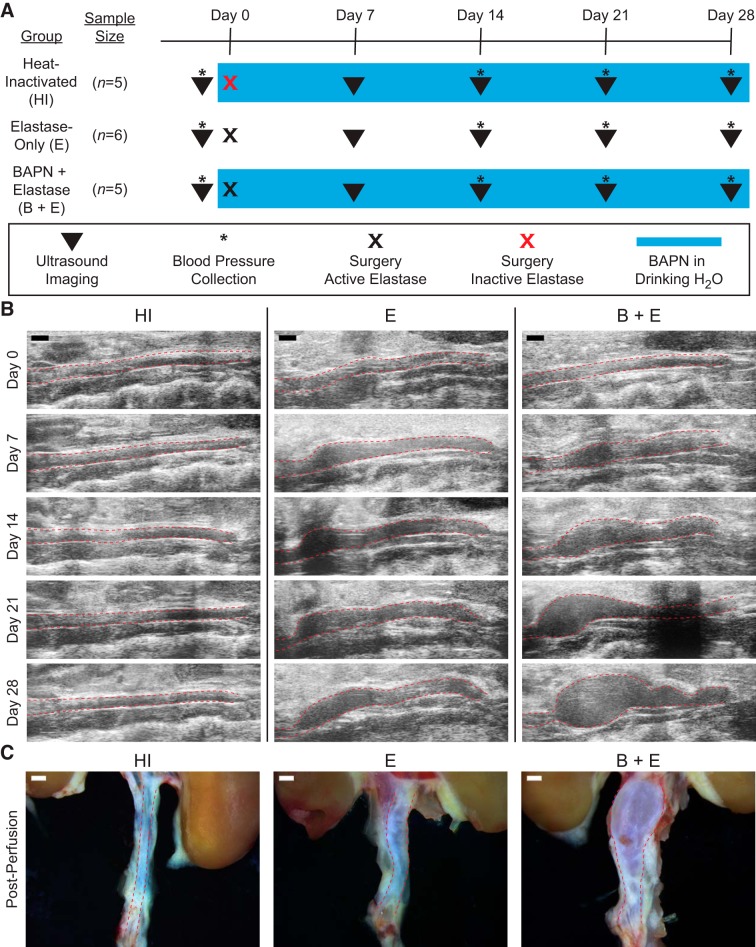
Fig. 1.
Experimental groups and methods. A: timing schematic showing weekly imaging (▼), blood pressure collection (*), and experimental differences between groups. Schematic also denotes surgery with 5 mg/mL active elastase (black x) and heat-inactivated (HI) elastase (red x), and ongoing β-aminopropionitrile (BAPN) placed in drinking water (blue box), with normal drinking water for the elastase-only (E) group. B: weekly ultrasound images demonstrating HI as an aorta of healthy size, E as a stable aneurysm, and BAPN-elastase (B + E) as a growing aneurysm. C: gross anatomy images from representative animals after agarose perfusion. Red dashed lines in B and C indicate aorta boundary. Scale bar, 1 mm for all images.

