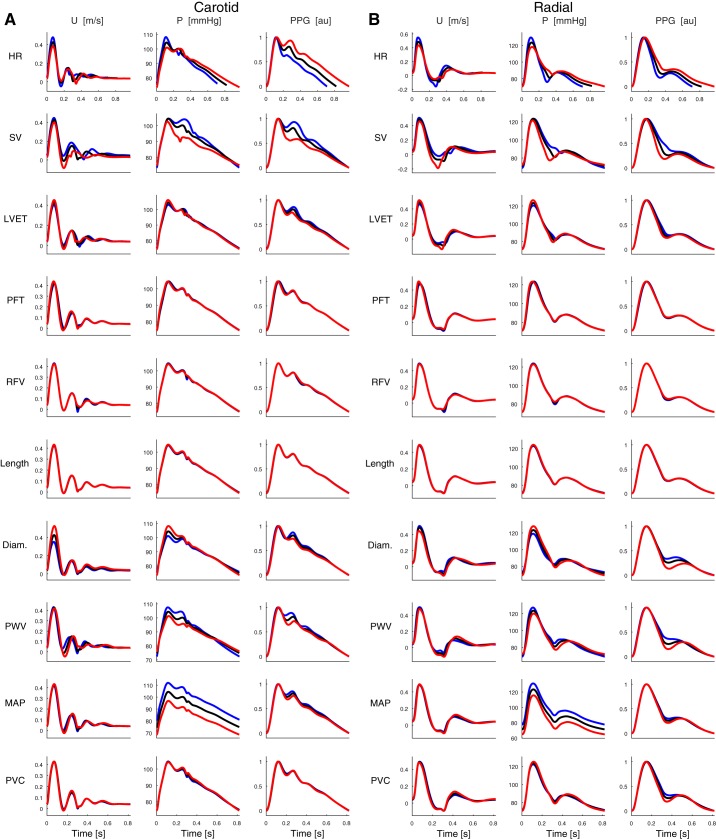
Fig. 3.
Pulse waves (PWs) for the 25-yr-old subject at the carotid artery (A) and the radial artery (B). The waves shown are at baseline (black), and those obtained when increasing (blue) and decreasing (red) each parameter independently by 1 SD from its baseline value. See glossary for definition of terms.

