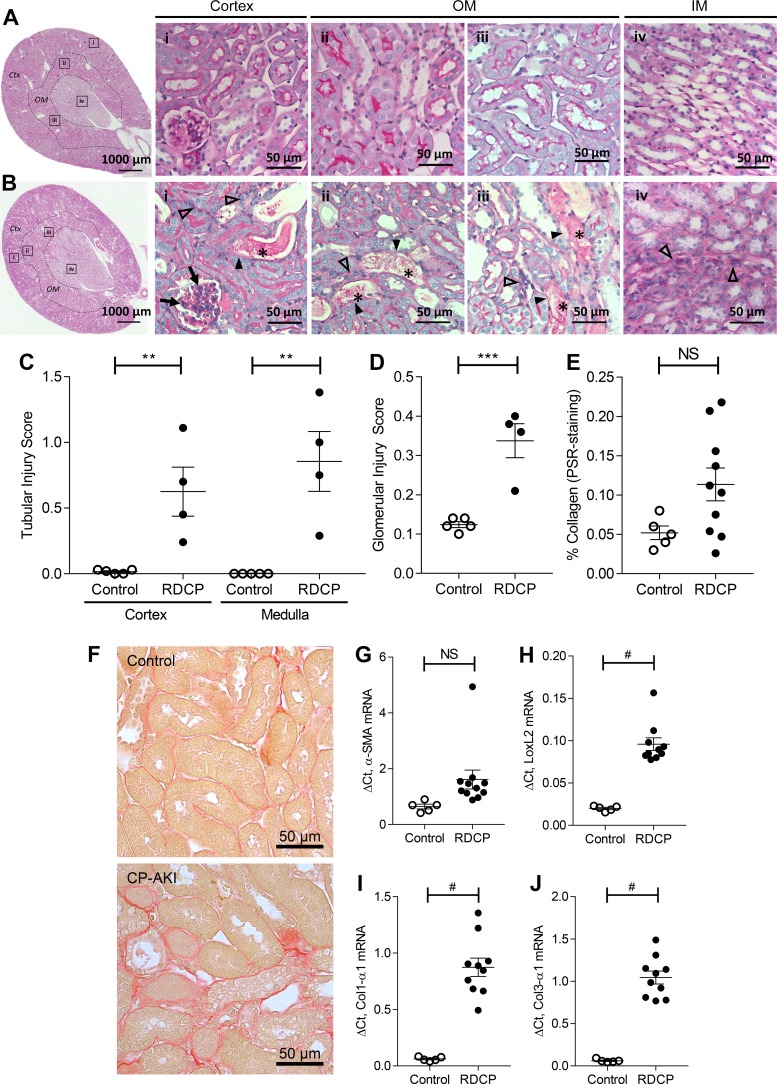
Fig. 2.
Tubular injury and fibrosis after repeated-dose cisplatin (RDCP). A–D: data from a separate cohort of mice given 7 mg/kg CP (n = 4) or vehicle (n = 5) weekly for 4 wk. A and B: representative images of a control kidney (A) and a CP-induced acute kidney injury (CP-AKI) kideny (B) at day 28. The highlighted boxes (i–iv) in the low-power images correspond to the magnified images to the right. In injured kidneys (B), dilated tubules with casts (*) show deepithelialization (solid arrowheads). Cortical glomeruli have mesangial expansion (arrows). Intratubular fibrosis and hypercellularity (open arrowheads) are found in the cortex (Ctx; i), outer medulla (OM; ii and iii), and inner medulla (IM; iv). C: tubular injury scores in the Ctx and OM from periodic acid-Schiff-stained kidney sections at day 28. D: glomerular injury score from periodic acid-Schiff-stained kidney sections at day 28. E–I: data from the same cohort of mice shown in Fig. 1. E: quantification of renal fibrosis (picrosirius red staining) in the OM at day 28. F: representative images of the OM of picrosirius red-stained kidney sections. G−J: mRNA expression of the following fibrosis markers: α-smooth muscle actin (α-SMA; G), lysyl oxidase-like 2 (LoxL2; H), collagen type I-α1 (Col1-α1; I), and collagen type III-α3 (Col3-α1; J) relative to GAPDH on day 28. Data points in C–E and G–J represent individual animals, with means ± SE of the groups indicated. A two-sided t-test was used to compare RDCP to control mice in C–E and G–J. NS, not significant (P > 0.05). **P ≤ 0.01; ***P ≤ 0.001; #P ≤ 0.0001.

