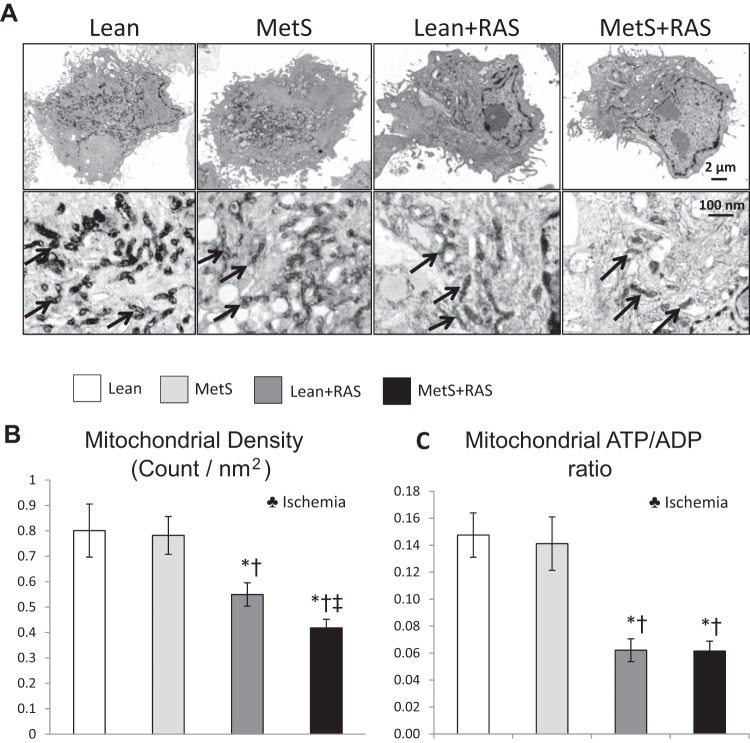
Fig. 3.
Scattered tubular-like cell (STC) mitochondrial density and function. A: transmission electron microscopy (original magnification: ×5 k and ×100 k) of STC mitochondria. B: STC mitochondrial density decreased in the lean diet-fed (Lean) + renal artery stenosis (RAS) group compared with the Lean and metabolic syndrome (MetS) groups and further decreased in the MetS + RAS group. C: the ATP-to-ADP ratio was comparably lower in Lean + RAS and MetS + RAS STCs versus Lean and MetS STCs. *P < 0.05 vs. the Lean group; †P < 0.05 vs. the MetS group; ‡P < 0.05 vs. the Lean + RAS group. ♣Ischemia: significant effect of ischemia (two-way ANOVA).

