Fig. 6.
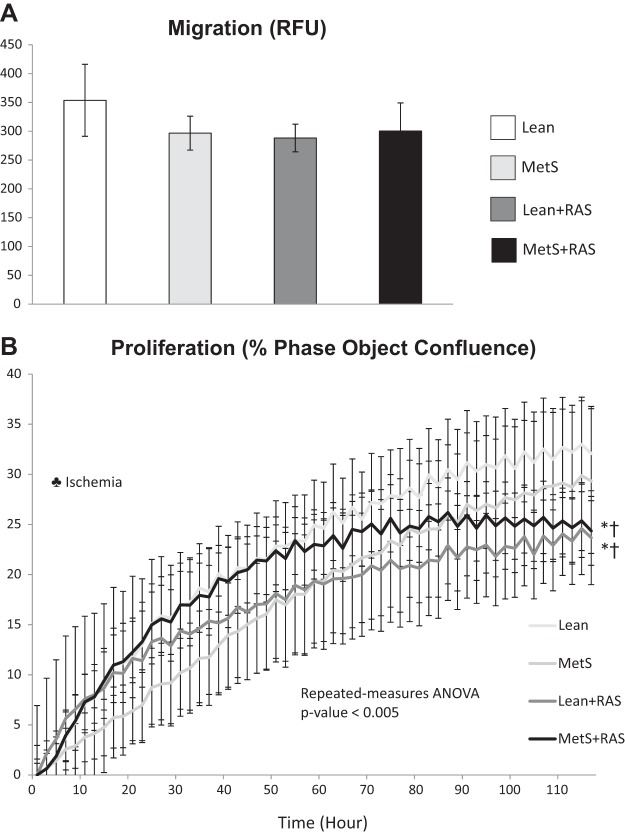
Scattered tubular-like cell (STC) migration and proliferation. A: migration of isolated STCs, measured by color density, was similar among study groups. B: STC proliferation, measured in percent phase object confluence unit, decreased in the lean diet-fed (Lean) + renal artery stenosis (RAS) and metabolic syndrome (MetS) + RAS groups compared with the Lean and MetS groups. *P < 0.05 vs. the Lean groups; †P < 0.05 vs. the MetS group; ‡P < 0.05 vs. the Lean + RAS group. ♣Ischemia: significant effect of ischemia (two-way ANOVA).

