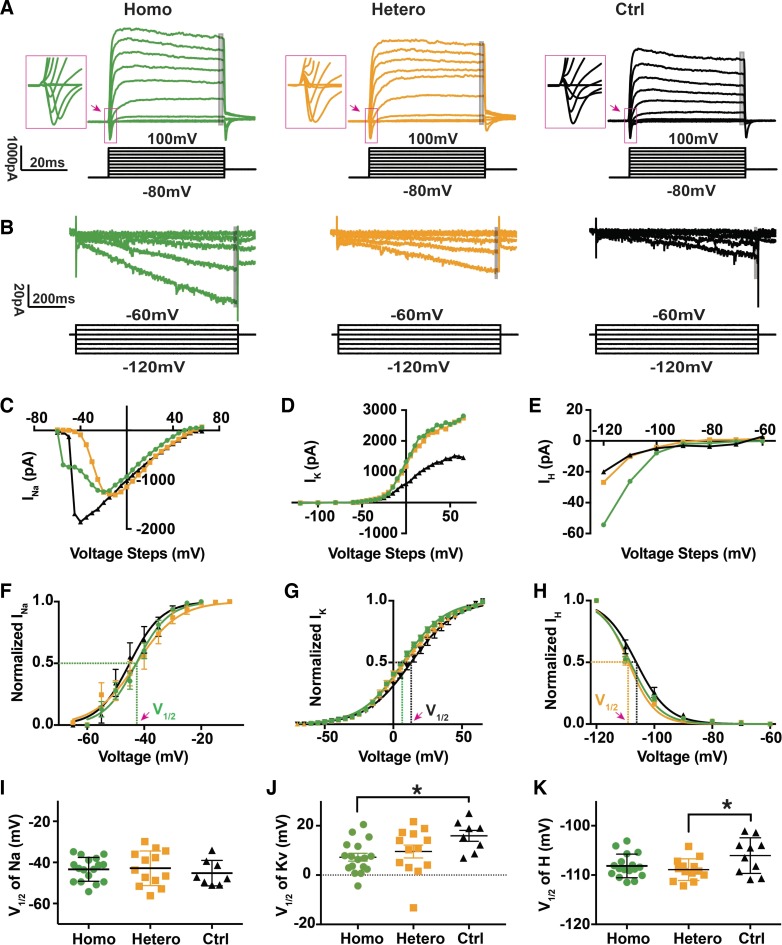
Fig. 5.
Effects of differential expression of ChR2R on voltage-activated currents. A: whole cell voltage-clamp recordings of inward and outward currents activated in homozygous, heterozygous, and control spiral ganglion neurons (SGNs) at postnatal day (P)2 to P4 in response to 20-mV voltage steps up to 100 mV from a holding potential of −80 mV. Insets illustrate the relevant inward currents (in pink squares) in high power. Gray area indicates the 2-ms trace where we calculated averaged potassium current. B: whole cell voltage-clamp recordings of inward currents activated in response to 10 mV voltage steps down to −120 mV from a holding potential of −60 mV from the same neurons as in A. Gray area indicates the 30-ms trace where we calculated averaged hyperpolarized inward current. C–E: sodium, potassium, and hyperpolarized inward current magnitudes (INa, IK, and IH, respectively) plotted as a function of voltage levels for individual recordings in the same 3 cells. In a few cases, the fast activating Na currents were too large and evaded voltage control, as apparent in the control current-voltage relation (C). The plateau in K current seen at higher voltages (D) may be influenced by internal Mg ions. F–H: normalized sodium, potassium, and HCN activation curves for the average of all recordings in each group. I–K: averaged half-activation voltage (V1/2) for voltage-gated sodium (NaV, left), potassium (KV, middle), and hyperpolarization-activated cyclic nucleotide-gated (HCN, right) channels from all 3 groups were plotted together. NS, no significant difference. *Significant differences (P < 0.05).

