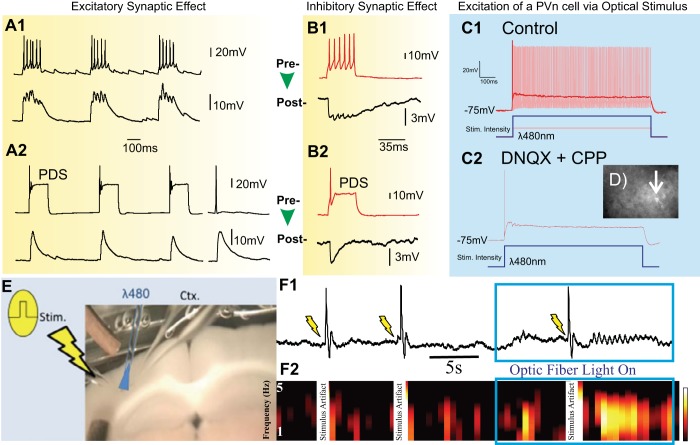
Fig. 4.
Experimental data gathered in cortical neurons on effects of paroxysmal depolarization on synaptic transmission and propagation. A: dual patch-clamp recording of coupled rat cortical neurons showing the effect of paroxysmal depolarization shift (PDS) on synaptic transmission between 2 excitatory neurons. B: dual patch-clamp recording of coupled rat cortical neurons showing effects between a presynaptic inhibitory cell (red traces) and a postsynaptic excitatory one (black traces). The recordings in A and B show that the postsynaptic output (bottom trace of each pair) and synaptic transmission is reduced when the presynaptic neuron (top trace of each pair) transitions from normal bursting (A1 and B1) to PDS activity (A2 and B2). A2 shows that the postsynaptic effect of PDS (3 bursts on left) is similar to that of a single presynaptic action potential (traces on right). Both the bursts in A1 and B1 were evoked with 20-pA injections; the injections to evoke the PDS in A2 and B2 were 80 pA and 45 pA, respectively. C: saturation effects shown with patch-clamp measurements in a red fluorescence identified parvalbumin-positive (PVn) inhibitory neuron upon optical stimulation in a brain slice from PVn-hChR2 mice ([postnatal day 30). C1: 2 superimposed responses at different light intensities: the lower intensity (150 μW delivered at slice surface) evoked rapid firing (light red) whereas the highest intensity (520 μW delivered at slice surface) resulted in a PDS (red). C2 depicts the same PDS response as in C1 and is obtained upon the same optical stimulation (520 μW) after the neuron was synaptically isolated from network excitation with 6,7-dinitroquinoxaline-2,3-dione (DNQX) and 3-(2-carboxypiperazin-4-yl)propyl-1-phosphonic acid (CPP). This demonstrates that the PDS behavior is an intrinsic property and not evoked via the network. D: image of fluorescent neocortical PVn neuron in brain slice from PVn-hChR2 mice (arrow) with micropipette. E: setup for the optical stimulation of the inhibitory PVn neurons. Electrical stimulation is indicated by the pulse and lightning flash on left; optical stimulation of the PVn neurons at the blue symbol at a wavelength (λ) of 480 nm. The extracellular measurement (Ctx) in the cortex is positioned right from the optical stimulus. F: the first 2 trials show how electrical stimuli alone do not result in propagation at the extracellular recording site: the responses in the integrated extracellular cortical signal (F1) and the associated spectrogram depicting frequencies 1–5 Hz (F2). The large deflections are stimulus artifacts. Interestingly, at the third stimulus given during strong optical activation of the inhibitory population, neural activity does propagate. The intensity of the optical stimulus in F is 520 μW, the same as used in C2. Color scale in F2: −35 to −20 dB/Hz.

