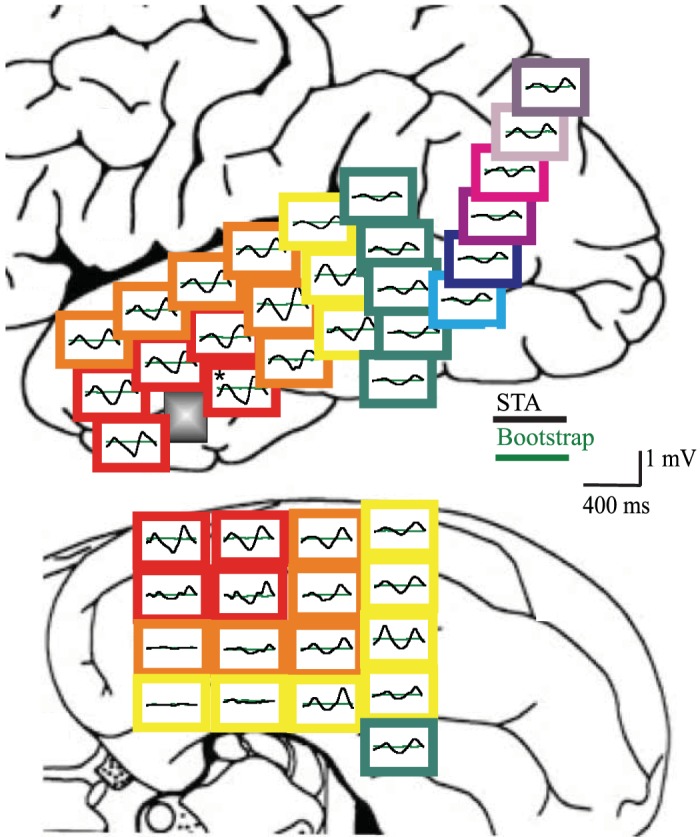
Fig. 7.

Macroscopic effect of the perturbator located at the gray square close to the temporal tip: lateral view (top) and basal view (bottom) showing the spike triggered averages (STAs) arranged spatially. At each location, the average (black) and its noise estimate (green) are depicted. It can be seen that the effect of the ictal wave activity ranges across a macroscopic centimeter-sized area (reproduced from Eissa et al. 2017).
