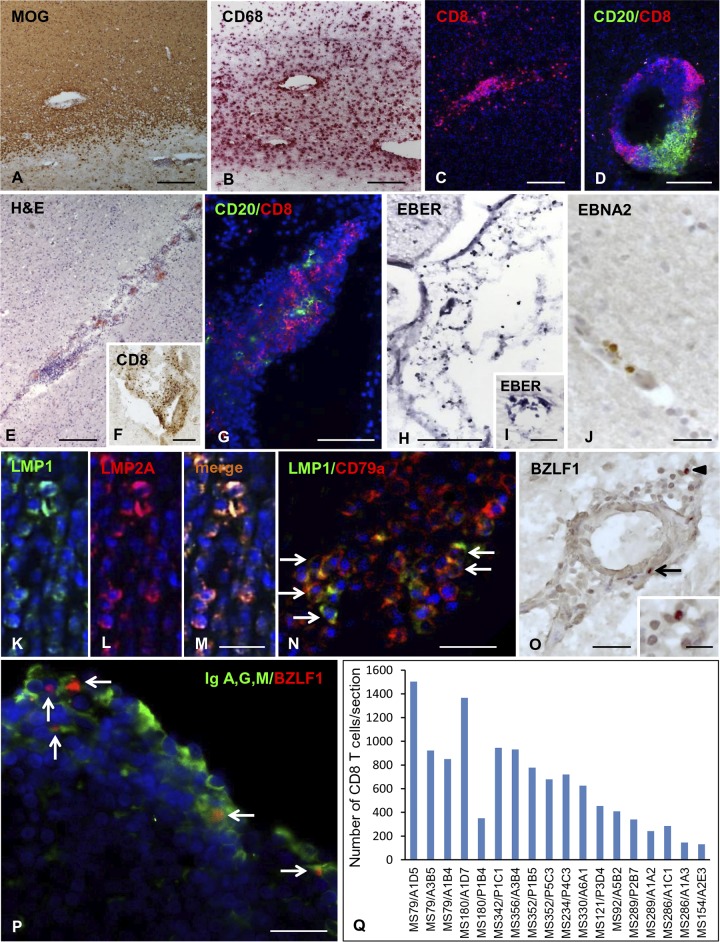
FIG 1.
Neuropathological characteristics, EBV infection, and CD8 T cell infiltration in the MS brain. Stainings of brain sections from 3 MS donors included in this study are shown. (A to D, donor MS121) Actively demyelinating WM lesion characterized by myelin loss (A, MOG immunostaining), foamy macrophages (B, CD68 immunostaining), and prominent CD8 T cell infiltration (C, CD8 immunostaining). A large perivascular cuff with high-density B cells and CD8 T cells is shown (D, double immunofluorescence for CD20 [green] and CD8 [red]). (E to G, donor MS79) Immune cell infiltrate (E, H&E staining) and CD8 T cells (F) in the meninges; double immunostaining for CD20 (green) and CD8 (red) reveals numerous CD8 T cells clustered around B cells in the meningeal infiltrate (G). (H to N, donor MS121) EBV-infected cells are visualized using EBER in situ hybridization; numerous EBER+ nuclei in the infiltrated meninges and in a perivascular cuff of a chronic WM lesion are shown (H and I, respectively). (J) Immunohistochemistry with anti-EBNA2 Ab reveals occasional perivascular cells expressing the latency III protein EBNA2 in a WM lesion. Double immunofluorescence stainings for LMP1 (green) and LMP2A or the B cell marker CD79a (red) reveal the presence of cells coexpressing LMP1 and LMP2A (K to M) and the expression of LMP1 in several perivascular CD79a+ B cells (N, arrows) in an active WM lesion. (O, donor MS92) Immunostaining with anti-BZLF1 MAb reveals nuclear immunoreactivity in two cells in the perivascular cuff of an active WM lesion (arrows; the inset shows the cell indicated by the arrowhead at high-power magnification). (P, donor MS92) Double immunostaining for IgA, IgG, and IgM (green) and BZLF1 (red) shows several Ig-producing plasma cells coexpressing BZLF1 in the meninges (arrows). (Q) Quantification of CD8 T cells in sections cut from 18 brain blocks of the 12 MS donors included in this study. CD8 T cells were visualized in bright field using anti-CD8 MAb and counted in the entire brain section; shown are the mean values for CD8 T cell counts in two sections of each tissue block. Nuclei were stained with hematoxylin (A, B, E, F, J, and O) or DAPI (C, D, G, K to N, and P). Bars, 200 μm (A to C and E), 100 μm (D and F to H), 50 μm (J and O), and 20 μm (I, K to N, P, and inset in O).

