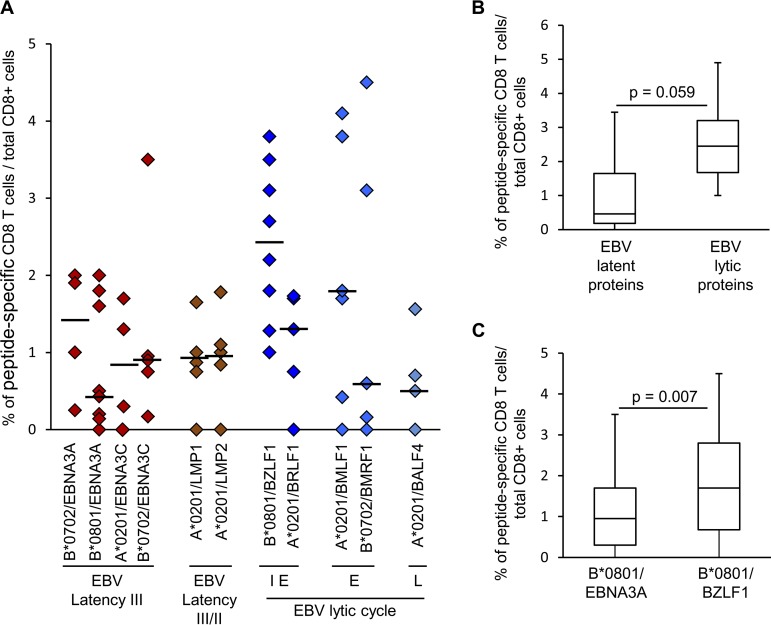
FIG 6.
Frequency of T cells specific for EBV proteins in the MS brain. Data are expressed as percentages of CD8 T cells specific for individual immunodominant peptides in the total CD8 population. (A) Each symbol represents the frequency of cells binding a given pentamer in each tissue block analyzed (n = 18 from 12 MS donors); the line marks the median value. Different phases of the EBV lytic cycle are indicated: IE, immediate early; E, early; L, late. (B) Comparison of the frequencies of CD8 T cells specific for EBV latent and lytic proteins assessed in 16 brain tissue blocks from 11 MS donors. (C) Comparison of the frequencies of CD8 T cells recognizing B*0801-restricted BZLF1 and EBNA3A peptides assessed in 8 tissue blocks from 6 HLA-B*0801+ MS donors. In panels B and C, P values were assessed by Mann-Whitney test. The lines inside the boxes represent the median values; boxes extend from the 25th to the 75th percentile, covering the interquartile range (IQR), and whiskers extend from the 25th percentile, −1.5 IQR, to the 75th percentile, +1.5 IQR.

