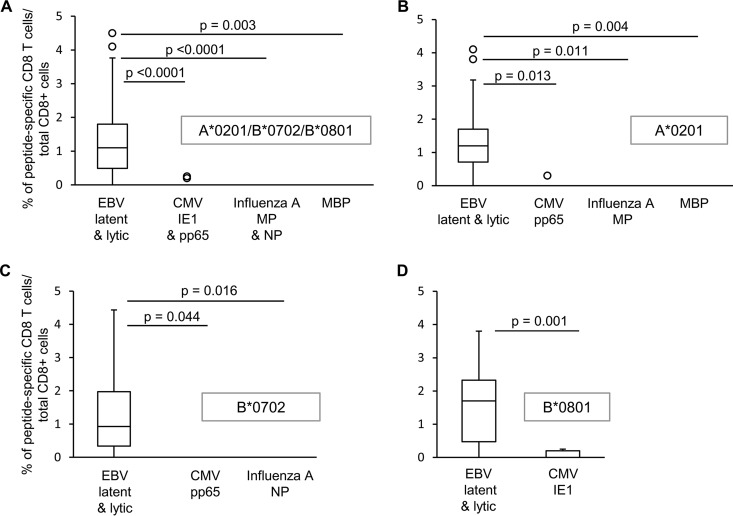
FIG 7.
Comparison of the frequencies of EBV-, CMV-, influenza A virus-, and MBP-specific CD8 T cells infiltrating the MS brain. The frequencies of CD8 T cells specific for viral protein- and MBP-derived peptides were compared irrespective of the HLA background (A) and in the same HLA background (A*0201 [B], B*0702 [C], or B*0801 [D]). Data are expressed as percentages of peptide-specific CD8 T cells in the total CNS-infiltrating CD8 population. P values were assessed by Kruskal-Wallis test with Dunn correction. The lines inside the boxes represent the median values; boxes extend from the 25th to the 75th percentile, covering the interquartile range (IQR), and whiskers extend from the 25th percentile, −1.5 IQR, to the 75th percentile, +1.5 IQR. Maximum outliers outside the whiskers are represented by individual marks.

