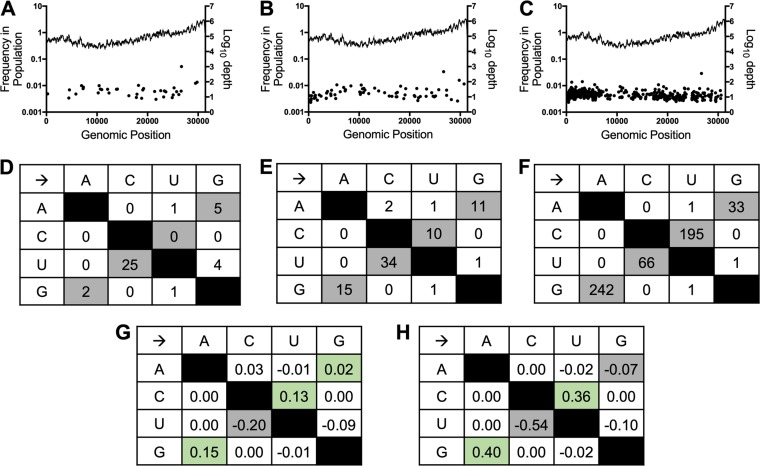
FIG 4.
NHC treatment drives an increase in low-frequency G:A and C:U transition mutations in WT MHV during a single infection. (A to C) Distribution and frequencies of variants across the genome detected by NGS after vehicle treatment (A), 2 μM NHC treatment (B), or 4 μM NHC treatment (C). The log10 depth of coverage at each genomic position is depicted by the lines; the frequencies of individual mutations spread across the genome are represented by the dots. (D to F) Numbers of mutations in WT MHV after infection in the presence of vehicle (D), 2 μM NHC (E), or 4 μM NHC (F) presented by type. Transition mutations are shown in gray, and transversion mutations are shown in white. (G and H) Changes in relative proportions of each mutation type after treatment with 2 μM NHC (G) or 4 μM NHC (H) compared to vehicle control. The relative proportions of G:A and C:U transitions increased with increasing concentrations of NHC treatment and are indicated by green shading.

