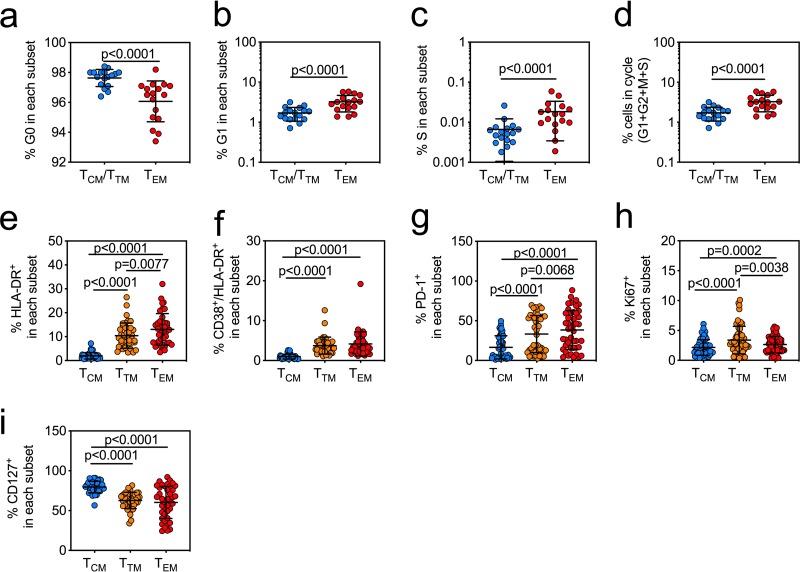
FIG 3.
The TEM subset is characterized by expression of markers of cell cycle entry and of T cell activation. (a to c) Percentages of CD4+ T cells in the TCM/TTM subsets (blue circles) and TEM subsets (red circles) in resting phase (G0) (a), growth phase (G1) (b), and DNA synthesis phase (S) and mitosis phase (M) (c) of the cell cycle from virally suppressed HIV-infected individuals (bars indicate means with SD from a Wilcoxon matched-pair signed-rank test [n = 17]). (d) Percentages of cells in the cycle are represented with the equation [(G1 + G2 + M + S)/(G0 + G1 + G2 + M + S)] × 100, which shows significantly more cycling cells in the TEM subset than in other subsets (bars indicate means with SD from a Wilcoxon matched-pair signed-rank test [n = 17]). (e to i) Percentages of cells in the TCM (blue circles), TTM (orange circles), and TEM (red circles) subsets positive for HLA-DR (n = 45) (e) or coexpressing CD38/HLA-DR (n = 45) (f), PD-1 (n = 45) (g), Ki67 (n = 57) (h), or CD127 (n = 40) (i). P values are indicated from a Mann-Whitney test. Measurements were based upon the availability of cells from each cohort.

