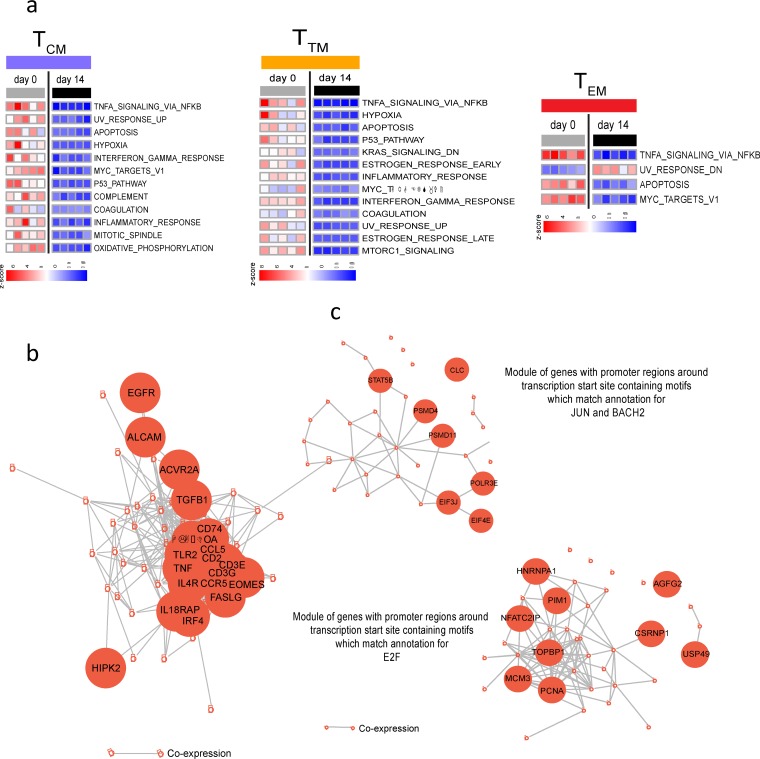
FIG 6.
Transcriptional profiling of memory subsets from LARA cultures. (a) Pathways significantly (P value < 5%) enriched among the genes differentially expressed in a comparison of day 14 to day 0 results for TCM, TTM, and TEM cells, respectively, by GSEA. The expression of pathways in each sample is represented by their z-scores, calculated using SLEA. The rows represent pathways, and columns represent samples. (b) GSEA of the genes differentially expressed between the TEM and TCM subsets in the LARA in vitro (day 14) culture using the Hallmark gene sets of MSigDB. Represented are the network of genes of the Hallmark allograft rejection pathway and the IL-2 STAT5 signaling pathway upregulated in effector memory cells (TEM) (P values < 5%), with edges inferred by GeneMANIA showing coexpression between genes, with certain genes of the pathways highlighted in larger nodes. (c) GSEA of the genes differentially expressed between TEM and TCM subsets in LARA in vitro culture, using the gene sets that share transcription factor binding sites defined in the C3 gene sets (TRANSFAC version 7.4) of MSigDB. The gene sets upregulated in TEM cells at a P value of <0.05 were grouped into related modules by the enrichment map strategy. Modules were defined if gene sets had an overlap of at least 25% genes between them. The genes represented in at least 50% of gene sets of a module and the edges inferred by GeneMANIA as being coexpression between genes are represented.

