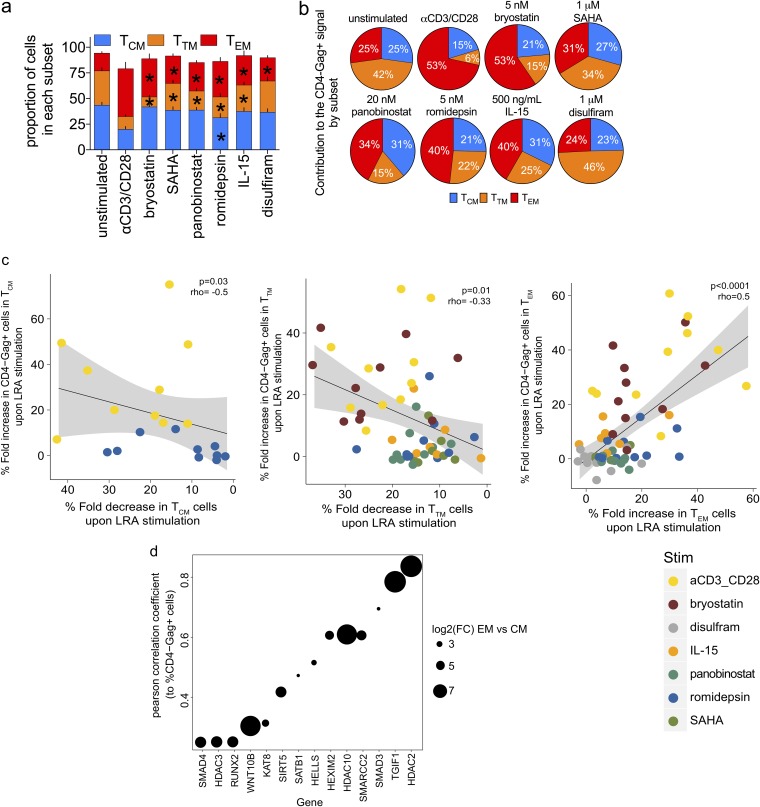
FIG 8.
The TEM subset shows the greatest contribution to latency reversal from different classes of LRAs. (a) The effect of LRAs on the distribution of the memory CD4+ T cell subsets was assessed and is represented by the percentage of cells in each subset in the CD45RA− population (bars indicate SEM; asterisks indicate a P value of <0.05 in a comparison of the drug with unstimulated controls in each memory subset, tested by a paired Wilcoxon rank sum test). (b) The contribution of the TCM, TTM, and TEM subsets to the overall CD4− Gag+ signal for each LRA was determined. Each pie slice was calculated using the frequency of cells in each memory subset from the CD4− Gag+ population. Frequency is indicated within each pie slice. n = 10. (c) Correlation between the percent change in CD4− Gag+ cells after LRA stimulation and the percent change in cells in the TEM, TTM, and TCM subsets after exposure to LRAs. Each circle represents an independent donor after administration of anti-CD3 CD28 (yellow), bryostatin (brown), disulfiram (gray), IL-15 (orange), panobinostat (green), romidepsin (blue), or SAHA (olive). P values of Spearman’s correlation test are indicated. (d) Genes of the HDAC gene sets expressed at day 14 in LARA in vitro culture in TCM and TEM cells correlated with the percentage of CD4− Gag+ cells measured postreactivation in TCM and TEM cells by anti-CD3 and CD28 antibody stimulation. The enrichment of gene sets was tested by GSEA using the PID HDAC pathway gene sets and custom gene sets as the database (enrichment P value < 0.05). The genes are represented on the x axis, and the Pearson correlation coefficient of each gene to the HIV msRNA is represented on the y axis. The size of the dots represents the log2 fold change of the gene in TEM cells compared to that in TCM cells.

