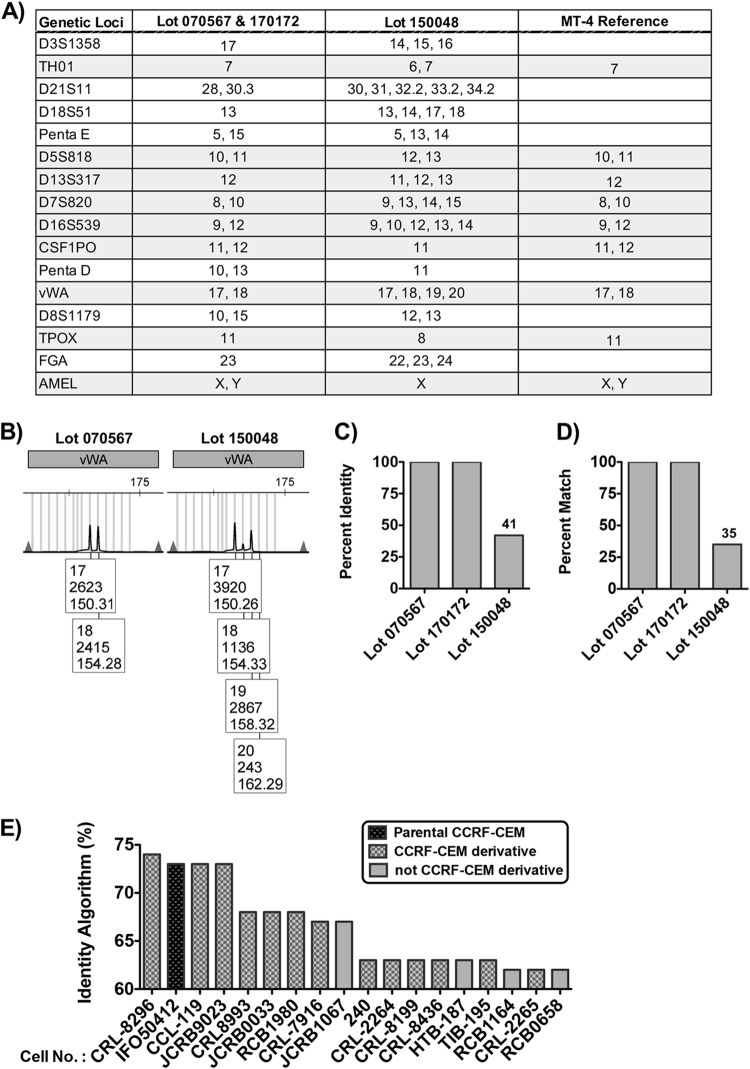
FIG 3.
STR profiling confirms that lot 150048 are not MT-4 cells. (A) Table listing the STR identities at various genetic loci for query lots of MT-4 and the MT-4 reference provided by Cellosaurus. (B) Electropherogram for the STR profile at the vWA gene locus for lots 070567 and 150048. Numbers in the box below each peak represent the following: top, allele call/STR peak; middle, peak height in relative fluorescent units; bottom, size of STR fragment in base pairs (distance traveled in the capillary). (C and D) Percent identity (C) and percent match (D) of query MT-4 lots to the MT-4 reference STR profile. (E) Percent identity of lot 150048 to best-match cell lines. Parental (black diamond grid) and derivative CCRF-CEM (gray diamond grid) are distinguished by bars with different patterns, while cell lines not related to CCRF-CEM are differentiated by bars with no pattern.

