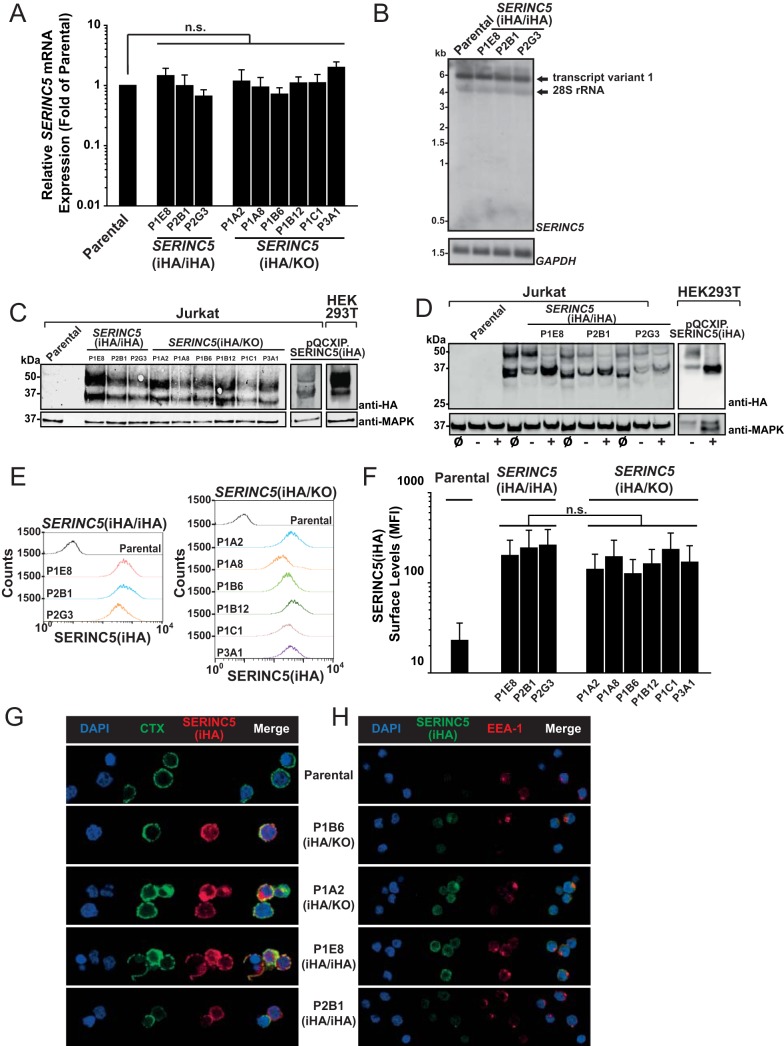
FIG 2.
Characterization of expression of endogenous SERINC5 protein and SERINC5 mRNA. (A) Q-RT-PCR analysis of SERINC5 mRNA expression in parental Jurkat T cells and the indicated clones. SERINC5 mRNA expression in parental T cells was set to a value of 1. Error bars indicate SEM of data from three independent experiments. (B) Total RNA from parental T cells and the indicated clones was subjected to Northern blotting using SERINC5- and GAPDH-specific probes. Shown are data from one representative experiment out of two independent experiments. (C) Lysates from the indicated cell lines and clones were subjected to anti-HA and anti-MAPK immunoblotting. Shown are data from one representative experiment out of three independent experiments. (D) Lysates from the indicated cell lines and clones were loaded either directly (input [ø]) or following mock digestion (−) or PNGase digestion (+) in glycoprotein-denaturing buffer. (E) The indicated cell lines and clones were immunostained for HA surface expression and analyzed by flow cytometry. Shown are representative histograms from one experiment out of three independent experiments. (F) Quantification of the mean fluorescence intensity (MFI) of SERINC5(iHA) surface expression. Error bars indicate SEM from three experiments, including the one shown in panel D. (G) The indicated clones were stained with CTX-FITC, followed by anti-CTX antibody and anti-HA antibody staining. Cells were then PFA fixed and analyzed by confocal microscopy. Shown are data from one representative experiment out of three independent experiments. (H) The indicated clones were PFA fixed, permeabilized, and immunostained with anti-HA and anti-EEA-1 antibodies. Shown are data from one representative experiment out of three independent experiments.

