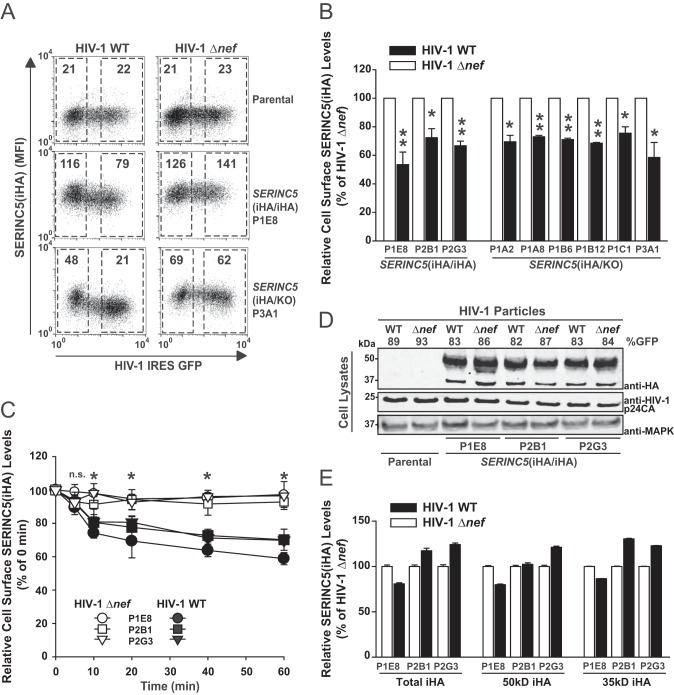
FIG 5.
HIV-1 Nef modulates the subcellular localization and trafficking of endogenous SERINC5. (A) Parental Jurkat T cells and the indicated clones were infected with the indicated VSV-G-pseudotyped viruses. At 2 days postinfection, intact cells were immunostained for surface HA prior to PFA fixation and analyzed for SERINC5(iHA) surface expression by flow cytometry. In the dot plots, the SERINC5(iHA) surface levels are plotted against GFP. Numbers inside the gates indicate the MFI of the surface SERINC5(iHA) signal. Shown are representative dot plots from one experiment out of three independent experiments. (B) Relative level of SERINC5(iHA) surface expression. The MFI for cell surface-expressed SERINC5(iHA) was quantified on GFP-positive cells in the R3 gate relative to the MFI of GFP-negative cells in the R2 gate. Values obtained for cells infected with the HIV-1 Δnef mutant were set to 100%. Error bars indicate SEM from three experiments. (C) HIV-1 Nef enhances the rate of endocytosis of endogenous SERINC5(iHA). Shown are kinetics of the decrease of surface-exposed SERINC5 in SERINC5(iHA/iHA) clones infected with WT HIV-1 or the HIV-1 Δnef mutant. The values at time zero were set to 100%. Error bars indicate SEM from three experiments. (D) Parental cells and the indicated clones were infected with the indicated VSV-G-pseudotyped HIV-1 at a high MOI. The percentage of GFP-positive cells is indicated. At 2 days postinfection, cell lysates were subjected to immunoblotting with anti-HA, anti-HIV-1 p24CA, and anti-MAPK antibodies. Shown is one representative blot from one experiment out of three independent experiments. (E) Relative levels of cell-associated SERINC5 protein in infected cells were quantified by Odyssey infrared-based imaging. Shown is the quantification of the total HA signal, of the 51-kDa band only, and of the 35-kDa band only. Error bars indicate SEM from three independent experiments.

