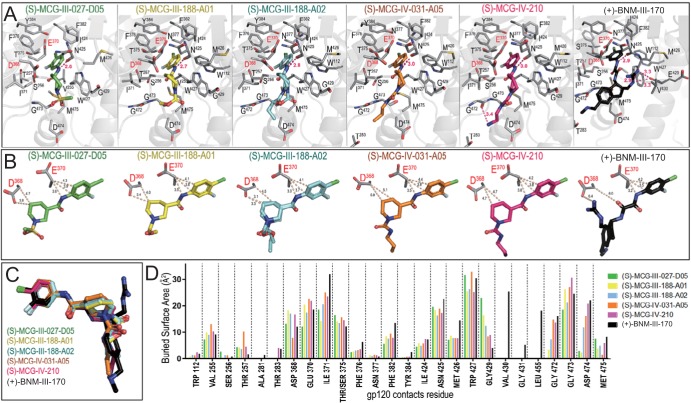
FIG 4.
Crystal structures of MCG analogs in complex with gp120CRF01_AE coree. (A) Blow-up views into the gp120 CD4 binding pocket. Complexes are shown as ribbon-ball-stick representations, with the side chains of gp120 residues contributing to the compounds’ binding shown as sticks. The H bonds are shown as pink dashes. (B) Details of the compounds’ interactions with gp120 Asp368 and Glu370. The closest distances between each compound and the side chain atoms of Asp368 and Glu370 are shown as dashes. (C) Superposition of MCG compounds onto BNM-III-170 (PDB accession number 5F4P). (D) Analysis of the compounds’ binding interface. The relative contribution of the indicated gp120 residue to each compound’s binding is shown as the buried surface area, as calculated by PISA. The buried surface area represents the solvent-accessible surface area of the corresponding residue that is buried upon interface formation.

