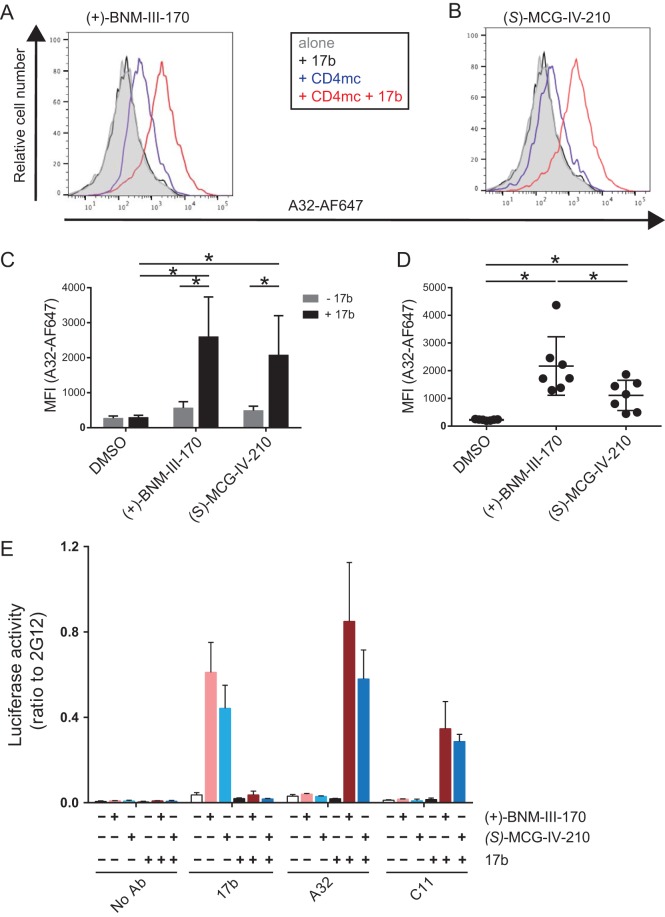
FIG 6.
(S)-MCG-IV-210 stabilizes state 2A at the surface of infected cells and virions. (A to D) For cell surface staining with A32-AF647, primary CD4 T cells isolated from PBMCs were infected with HIV-1CH58TF for 48 h. Cells were then incubated with A32-AF647 together with 5 μg/ml 17b (A to C) or 1:1,000-diluted HIV+ plasma from infected individuals (D) in the presence of DMSO, 50 μM (+)-BNM-III-170, or 50 μM (S)-MCG-IV-210 at 37°C. The mean fluorescence intensity (MFI) of A32-AF647 was measured by flow cytometry. (E) For the VCA, virus produced from HEK293T cells cotransfected with plasmids pNL4.3 Luc Env−, HIV-1CH58TF, and VSV-G was incubated with or without 5 μg/ml 17b in the presence of DMSO, 50 μM (+)-BNM-III-170, or 50 μM (S)-MCG-IV-210 at 37°C for 1 h. Virus was then applied to ELISA plates coated with Ab 2G12, 17b, A32, or C11 overnight at 4°C. Free virions were washed away, and HEK293T cells were added to the well. After 48 h, cells were lysed, and luciferase activity was measured. To compare the binding capacities of different Abs, the relative ratio of the luciferase activity to the luciferase activity of 2G12 was calculated. Data shown are the means ± SD from at least three independent experiments. Statistical significance was evaluated using a Mann-Whitney unpaired t test (C) or a Wilcoxon paired t test (D) (*, P < 0.05).

