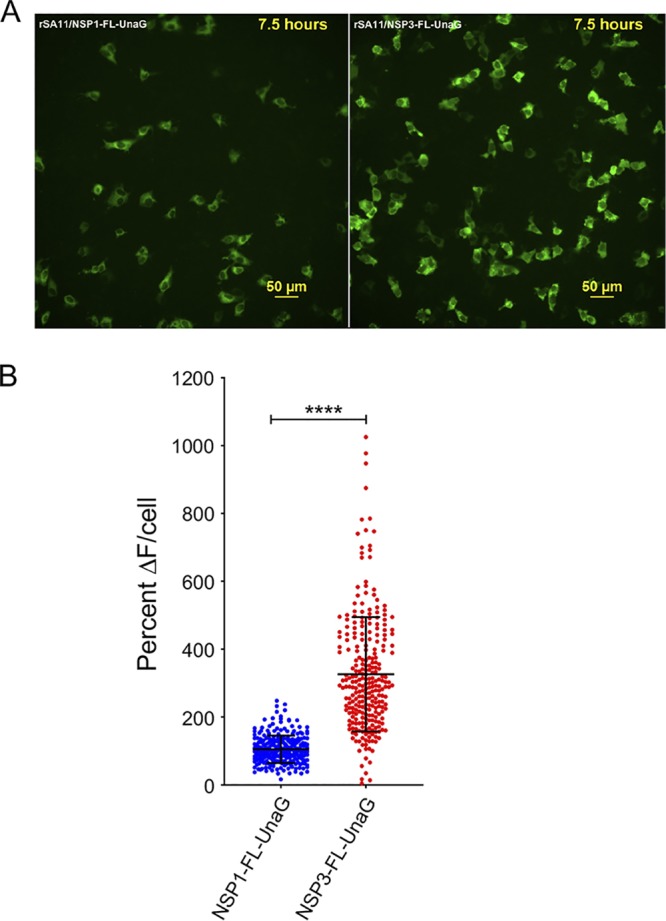
FIG 6.

Comparison of UnaG expression by rSA11/NSP3-FL-UnaG versus rSA11/NSP1-FL-UnaG. (A) Images of MA104 cells infected with rSA11/NSP1-FL-UnaG (left panel) and rSA11/NSP3-FL-UnaG (right panel) taken at 7.5 hpi with an epifluorescence Nikon TiE inverted microscope with a 20× Plan Apo (NA, 0.75) differential interference contrast objective. (B) Quantification of the percent change in UnaG fluorescence (ΔF) in MA104 cells infected with rSA11/NSP1-FL-UnaG or rSA11/NSP3-FL-UnaG. Single-cell analysis (n = 270 cells each) was performed to determine the percent ΔF versus baseline. Data are shown as mean ± standard deviation. ****, P < 0.0001.
