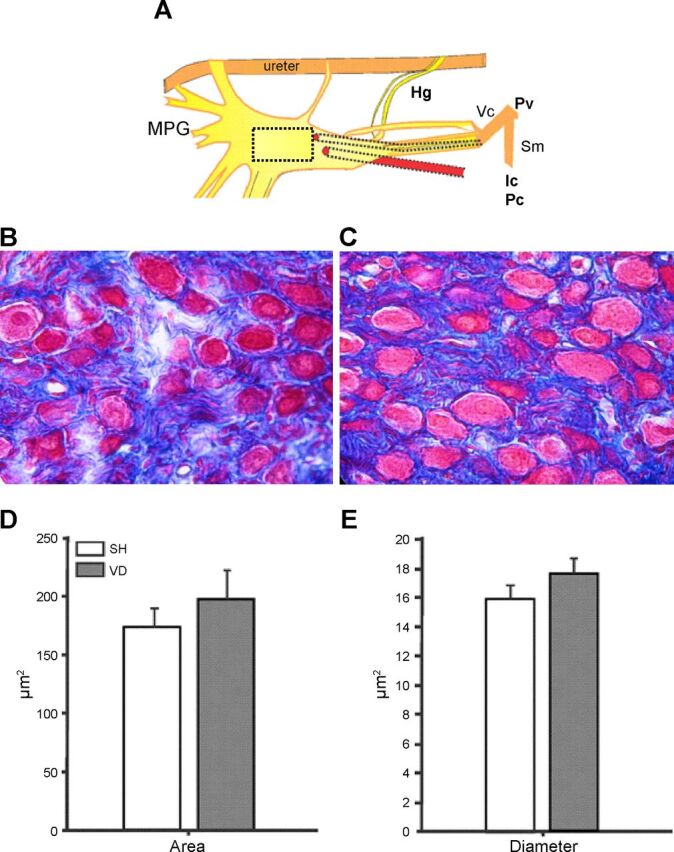
Fig. 5.

MPG neurons. The drawing in A represents the MPG; the square shows the site where tissue for the microphotographs was taken. Representative postganglionic neurons of SH (B) and VD (C) groups are shown. The graphs indicate the area (D) and diameter (E) of 20 neurons/rat. Values are means ± SE of data from 4 animals. Hg, hypogastric nerve; Pv, pelvic nerve; Vc, viscerocutaneous branch of the Pv; Sm, somatomotor branch of the Pv.
