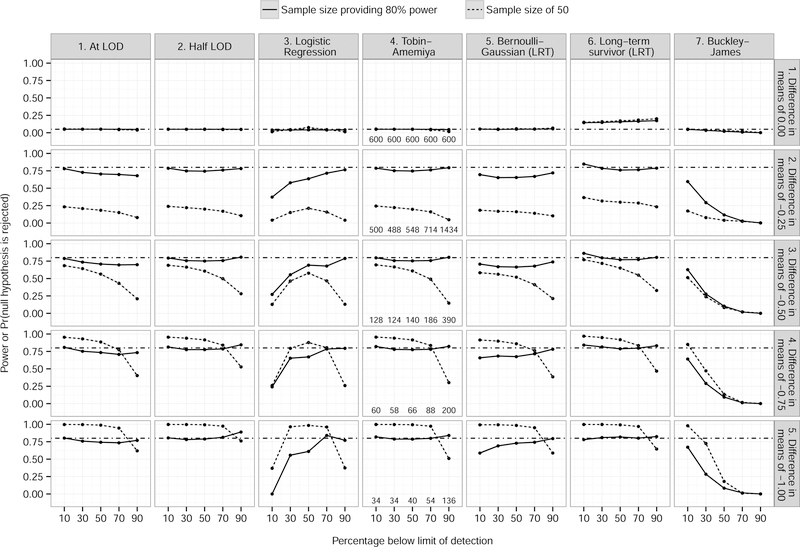
Figure 1.
Null hypothesis rejection proportion (power), broken down by method, difference between treatment and control means, and sample size providing 80% power (solid lines; sample sizes for the row are listed along the bottom of plots in the fourth column) and a fixed sample size of 50 (dashed lines), 10,000 simulations, 5% level of significance. Dot−dash lines indicate nominal power of 0.80, except when there is no difference in means (row 1) where the nominal power is equal to the type I error rate of 0.05. Grey shading denotes 95% confidence interval.

