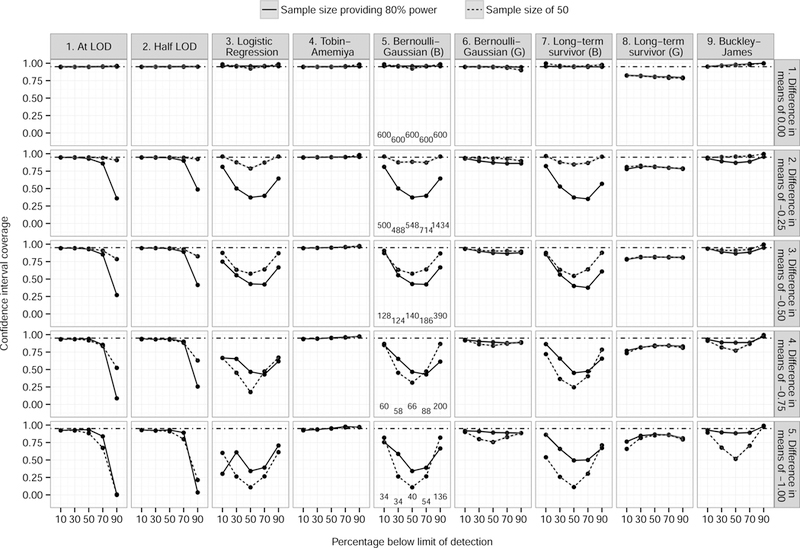
Figure 2.

Confidence interval coverage of true effect size, broken down by method (and component if applicable), difference between treatment and control means, and sample size providing 80% power (solid lines; sample sizes for the row are listed along the bottom of plots in the fifth column) and a fixed sample size of 50 (dashed lines), 10,000 simulations, 5% level of significance. Dot−dash lines indicate expected confidence interval coverage of 0.95. Grey shading denotes 95% confidence interval. In method titles, B=Bernoulli component and G=Gaussian component.
