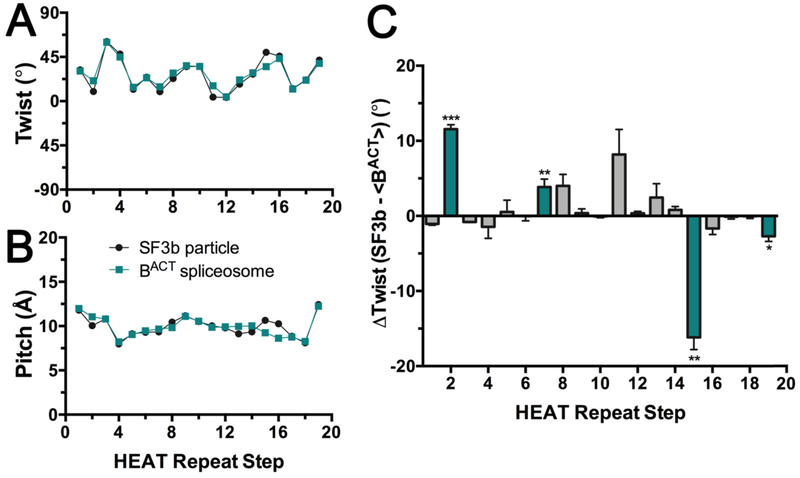
Figure 6.
Relationship between consecutive HEAT repeats of the SF3b1 superhelix in the context of the isolated particle (black, PDB ID 5IFE) or spliceosome (teal, PDB ID 6FF4). The plots analyze the intramolecular step from one HEAT repeat to the next in the indicated superhelix. The steps are numbered on the x-axis for clarity: Step 1 corresponds to the relationship of HEAT repeat 1 (HR1) to HR2, Step 2 corresponds to the relationship of HR2 to HR3, and so forth. (A) The rotational angle (twist) between the principal axes of α-helices from consecutive HEAT repeats. (B) Bar graph of the differences in the rotational angle of consecutive HEAT repeats between SF3b1 in the two contexts. The average values and standard deviation for the two relatively high resolution human BACT structures (PDB ID’s 6FF4 and 5Z58) compared to the SF3b particle are given. Unpaired, two-tailed t-tests with Welch’s correction analyze the rotational difference of each repeat relative to the average difference over all repeats: ***, p <0.0005; **, p <0.005; *, p <0.05; not significant, p >0.05. Repeats with significant differences are colored teal. (C) Translational shift (pitch) between centroids of α-helices from consecutive HEAT repeats. No significant differences in pitch of the superhelix are observed among structures. Results from comparison of the C-terminal α-helix of each di-helical HEAT repeat are shown (residue ranges in Table S1), which avoids a disordered region of SF3b1 in the isolated particle (residues 1093 – 1106). Similar results are obtained from comparison of the intact dihelical units as well as human or yeast homologues (Fig. S1). Representative scripts are given as Supplementary Materials.

