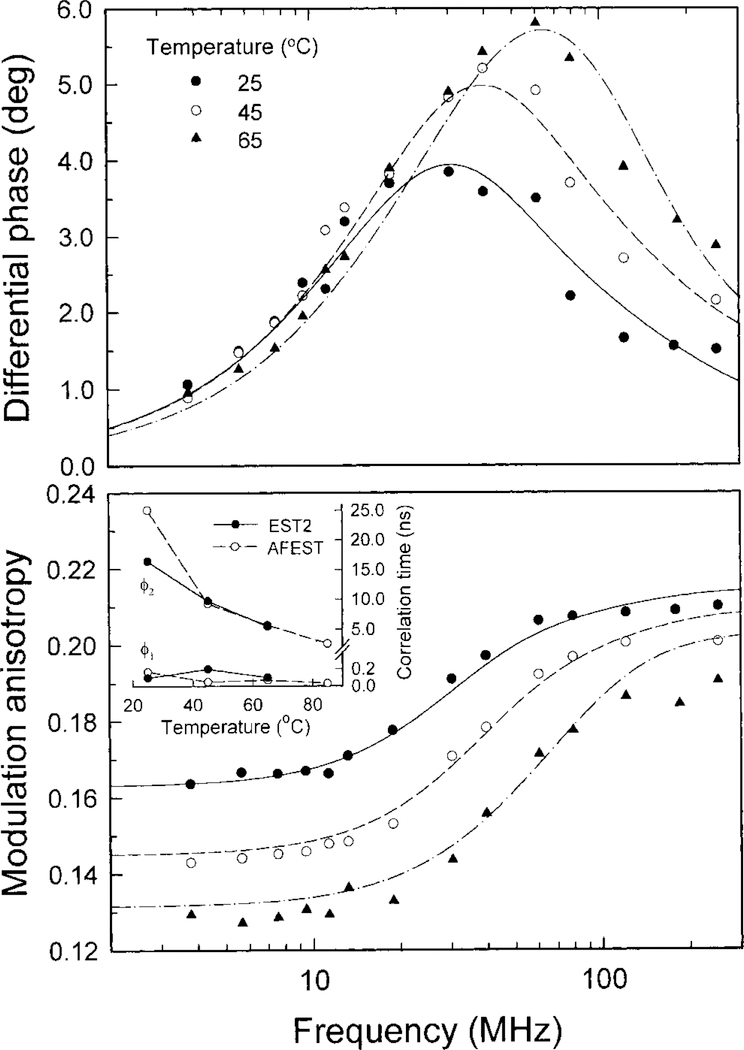
Fig. 11.
Frequency-domain anisotropy decays of tryptophan emission of EST2 at the indicated temperatures. The differential phases and the modulated anisotropies are shown in the upper and lower panels, respectively. The lines represent the best double correlation time fits. The temperature-dependent correlation times of EST2 and AFEST are shown in the inset.

