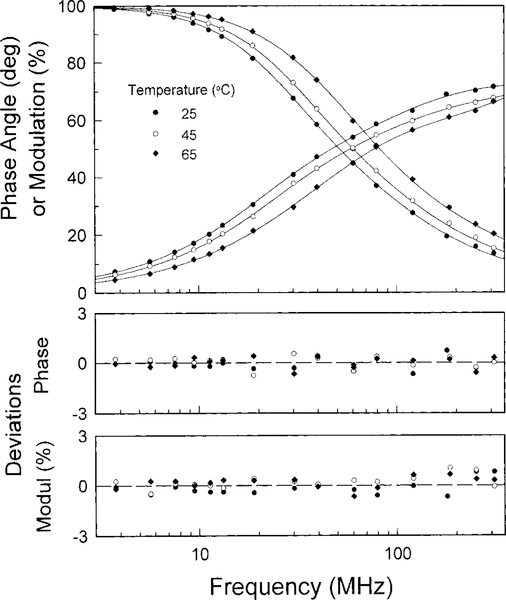
Fig. 8.
Frequency dependence of the phase shift and demodulation factors of EST2 fluorescence emission at the indicated temperatures. The solid lines represent the best triple-exponential fits. Fluorescence was excited by a frequency-doubled rhodamine 6G dye laser at 298 nm and the absorbance of the enzyme solution was below 0.1 at the excitation wavelength. Emission was selected by a Corning 7–60 and cut-off 345 nm filters. The protein concentration was 0.05 mg/ml in 50 mM Tris-HCl, 2.5 mM MgCl2, 0.5 mM EDTA, 1 mM DTT buffer, pH 7.1.

