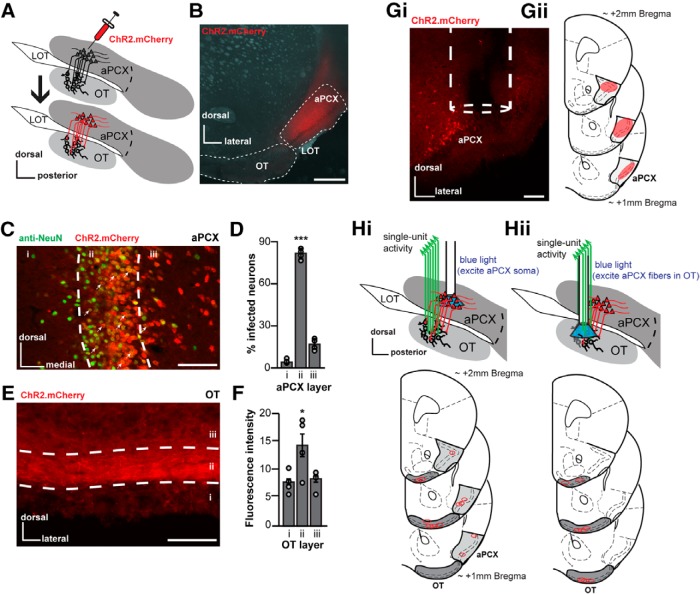
Figure 1.
Viral strategy for activating aPCX principal neurons. A, Schematic of the AAV injection procedure that was used to express ChR2 in aPCX neurons and association fibers. LOT, Lateral olfactory tract. After injection of AAV into the aPCX (top) 2–3 weeks were allowed for viral transduction, after which mice were used for in vivo recordings (bottom). B, Representative image of a aPCX AAV injection (AAV5.CaMKIIα.hChR2(H134R).mCherry) restricted into specifically the aPCX (white dotted outline). Scale bar, 500 μm. C, Representative image of aPCX neurons (anti-NeuN, marker for neuronal nuclei) transduced with AAV5.CaMKIIα.hChR2.E123T.T159C.p2A.mCherry.WPRE across aPCX layers i–iii. Scale bar, 100 μm. White arrows indicate colabeled cells. Anti-NeuN histochemistry was performed on tissue from mice not used for recordings. D, Quantification of AAV transduction in the aPCX across animals (n = 4) as a percentage of mCherry+ cells compared with NeuN+ cells in each aPCX cell layer. ***p < 0.001. E, Image of mCherry+ association fibers within the OT that originated from the aPCX. Scale bar, 100 μm. F, Average fluorescence intensity (arbitrary units) of aPCX association fibers in each OT layer across animals (n = 4) as a function of background fluorescence. *p < 0.05. Gi, Representative coronal brain section displaying the location of an optical fiber in aPCX. Scale bar, 100 μm. Gii, Estimated range of viral vector spread in anterior aPCX across all mice (those used for the preparations shown in both Hi and Hii, n = 14 mice). Qualitative range of viral vector spread across all animals, on average, was +2.0 mm bregma to +1.0 mm bregma, with the center of infection between +1.5 to +1.3 mm bregma. H, Location of implant sites for either separate optical fiber into aPCX and fixed electrode array in OT preparation (n = 6 mice; Hi) or optetrode array into the OT preparation (n = 8 mice; Hii).

