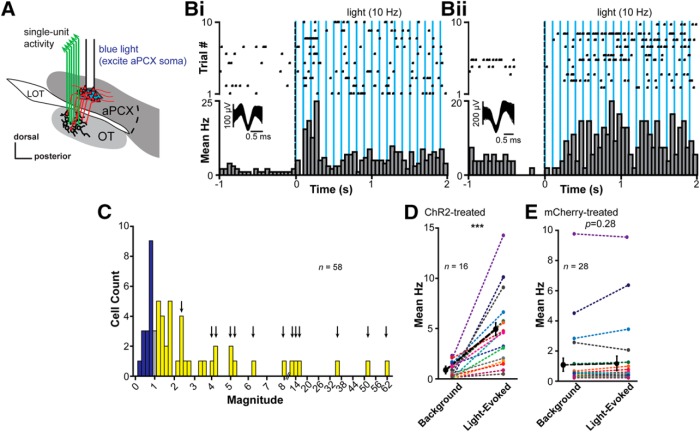
Figure 3.
aPCX neuron activation influences OT neuron firing. A, Schematic of the location of the optical fiber in aPCX for light stimulation of aPCX soma and the fixed electrode array in the OT for extracellular recordings. B, Examples of significant light-evoked activity of two OT single units by stimulation of the aPCX. Each raster plot and histogram represents a single unit's response to light stimulation across 10 trials. Average waveforms for each unit are represented within the histogram. Responses to aPCX light stimulation in these examples evoked either transient (Bi) or sustained (Bii) activity. C, Distribution of the average light-evoked response magnitude (ratio of spike numbers pre, compared with during, stimulation) across the population of recorded units. A majority displayed increases in firing to aPCX light stimulation (yellow), whereas some reduced firing (dark blue) and a small number showed no change (gray). Colors imply direction of changes, not statistical significance. Arrows indicate bars where units contributed to the plot in D. Double-line break in x-axis denotes change in magnitude binning (from 0.2 to 2) to represent sizable changes in magnitude upon light stimulation. Within-unit significance determined by paired t tests comparing firing during background versus light. D, Distribution of the change from average background activity to light-evoked activity. Of 16 significantly light-responsive units, all units increased their firing rates. As a population, these units were significantly excited from background activity (***p < 0.001). Data were normalized to each unit's background firing rate. E, Absence of light activation in “control” infected units (aPCX cells without ChR2 expression, AAV5.CaMKIIα.mCherry). There is no significant effect of light stimulation on firing rates among individual units (p ≥ 0.195; paired t tests) or across all units as a population (p = 0.28) in these mCherry-infected animals. Bold black dashed line in D and E indicates the population mean.

