Figure 5.
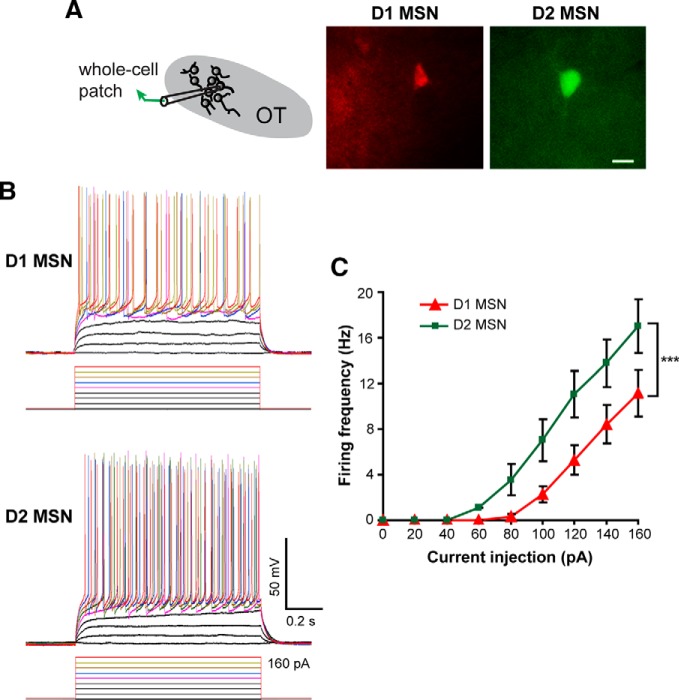
Differential electrophysiological properties of OT D1 and D2 MSNs. A, Schematic of paradigm for recording OT D1 (red) and D2 (green) MSNs in OT slices visualized under fluorescent illumination. Scale bar, 10 μm. B, Firing patterns of D1 and D2 MSNs in response to current injections (20 pA steps). Baseline membrane potential = −70 mV. C, Firing frequencies of D1 and D2 MSNs plotted against the injected currents. D1 MSNs displayed significantly higher thresholds and fired fewer action potentials than D2 MSNs. ***Two-way ANOVA (cell type and current step as two factors), F = 31.76(38), p < 0.001 for cell type.

