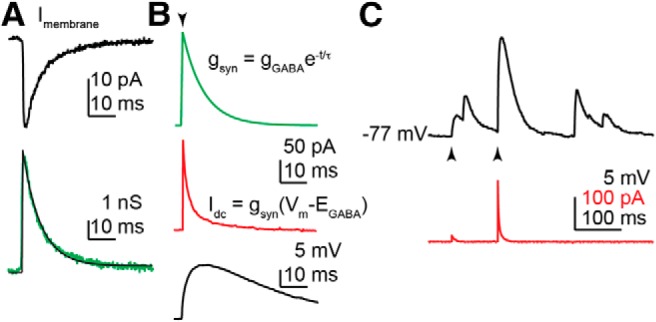
Figure 3.

A, Averaged GABA PSC (top, black) recorded at −75 mV using 15 mm Cl− pipette solution (EGABA = −55 mV). The current trace was converted to conductance (bottom, green), by dividing by the driving force of −20 mV, and fit with a monoexponential function (bottom, black) to determine tau, which was used in the rest of the studies. B, The simulated GABA conductance (top, green) constructed from the monoexponential function derived from the fit in A. During a triggered event (arrowhead), the dynamic clamp current is calculated from the conductance waveform, scaled by gGABA, and the driving force (Vm − EGABA), updated at ∼50 kHz with real-time measurement of the membrane potential (Vm). Idc (middle, red) is the analog output of the dynamic clamp system. The response to this stimulus signal in current-clamp mode is shown in the black trace (bottom). C, Membrane potential response (dcPSPs; black) to simulated GABA conductances (gGABA = 1 and 10 ns; arrowheads) is similar to spontaneous GABA PSPs in the trace; the current injected by dynamic clamp (Idc) is shown in red.
