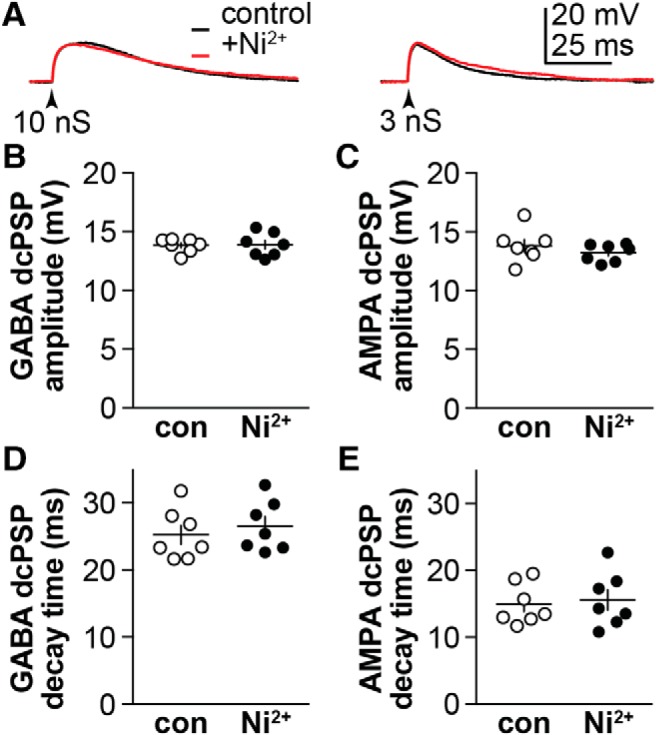
Figure 5.

Voltage-gated calcium currents do not sculpt membrane response in cells from OVX+E mice during triggered GABA (10 nS) or AMPA (3 nS) dcPSPs (arrowheads). A, Representative traces under control conditions (black) and 300 μm Ni2+ (red) for GABA dcPSPs (left) and AMPA dcPSPs (right). B, C, Individual values and mean ± SEM of GABA and AMPA dcPSP amplitude. D, E, Individual values and mean ± SEM of GABA and AMPA dcPSP decay time constant. Two-tailed, paired Student's t test. GABA peak: p = 0.8845, t = 0.1515, df = 6; GABA tau: p = 0.1852, t = 1.496, df = 6; AMPA peak: p = 0.3670, t = 0.9754, df = 6; AMPA tau: p = 0.4053, t = 0.8949, df = 6.
