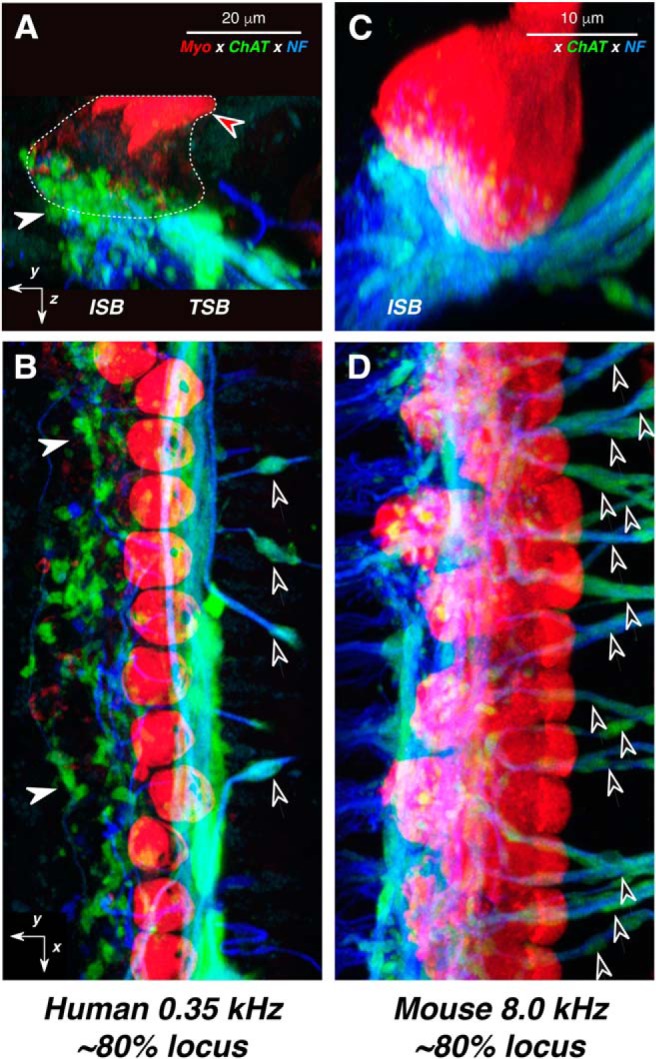
Figure 10.

LOC innervation density in humans is comparable to that in mouse. A–D, Confocal projections from the cochlear region with maximal LOC innervation: 0.35 kHz in human (A, B) vs 8.0 kHz in mouse (C, D). The human case patient was a 59-year-old female. For each species, two views of the same confocal z-stack are shown: B and D are maximum projections in the acquisition plane (yx), while A and C are maximum projections of the entire z-stacks in the yz plane. Orientation arrows in A and B also apply to C and D, respectively: the x arrows point along the spiral toward the apex, y arrows point radially away from the modiolus, and z arrows point toward scala tympani. White arrowheads in A and B point to ChAT-positive LOC terminals at the bases of IHCs; black-filled arrowheads in B and D point to the ChAT-positive tunnel-crossing fibers that give rise to MOC terminals. Red-filled arrowhead in A points to IHC cuticular plates, and the rough outline of IHCs is shown as a dashed line. The immunostaining key in A applies to all panels. Scale bars in A and C apply to B and D, respectively.
